Story Highlights
- Index reaches new high of +50
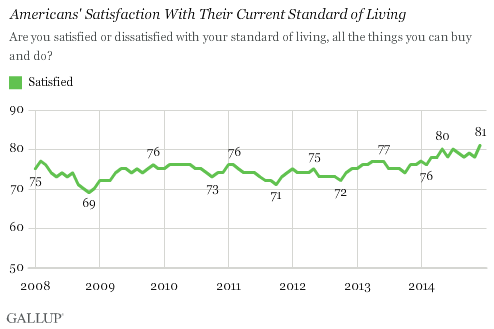
- Record 81% of Americans satisfied with standard of living
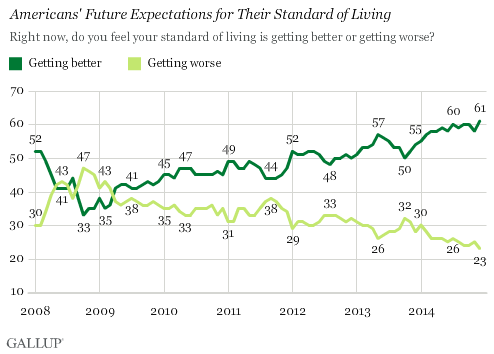
- Sixty-one percent say standard of living is "getting better"
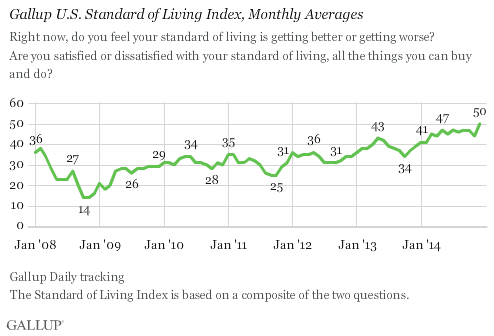
WASHINGTON, D.C. -- Gallup's Standard of Living Index reached a new high of +50 in December, the best score found in seven years of tracking the index. Americans' improved perspective on their personal standard of living comes as they spend more money and begin to view the national economy positively.

The index has labored through a long recovery from its recession-era slump, with lows of +14 in both October and November of 2008, when the global economic crisis erupted. But the latest ratings exceed even pre-crisis levels in 2008, illustrating a remarkable turnaround in how Americans view their standard of living.
The year 2014 started off with better standard of living readings than practically all other monthly readings before, with a +41 in January and February. From March to November, it improved further, but remained in a narrow range of +44 to +47. The +50 rating for December brings the index to an unprecedented level in its seven-year trend.
Gallup's Standard of Living Index is a composite of Americans' responses to two questions: one asking whether they are satisfied with their current standard of living, and the other asking whether their standard of living is getting better or worse. The index has a theoretical maximum of 100 (if all respondents say they are satisfied with their standard of living and say it is getting better) and a theoretical minimum of -100 (if all respondents are dissatisfied with their standard of living and say it is getting worse). The current score of +50 indicates Americans are quite positive about their standard of living, but even at its lows in the fall of 2008, Americans evaluated their standard of living positively overall.
Both dimensions of the index have improved by roughly five points over the past year -- however, since the nadir of these perceptions in 2008, people's outlook for their standard of living going forward has improved much more than their current satisfaction with it.
Four in Five Americans Satisfied with Their Current Standard of Living
A consistent majority of Americans have expressed satisfaction with their standard of living over the past seven years, ranging from 69% in late 2008 to 81% today. However, after fluctuating in an even narrower seven-point range from 2009 through 2013, it rose from 76% at the end of 2013 to 81% at the end of 2014.

Optimism for Improving Standard of Living Reaches New High
While Americans are becoming more satisfied with their current standard of living, they are also becoming more optimistic about its future. Sixty-one percent of Americans now say their standard of living is "getting better" -- a new high, and nearly twice the level it was at its low of 33% in October 2008.
Less than a quarter of Americans (23%) say their standard of living is "getting worse."

Bottom Line
Though most Americans' personal financial situation probably doesn't change dramatically from one year to the next, an improving economy and soaring stock market likely help them feel better about their own situation. To some degree, this is evident in reports from Gallup's daily tracking data of increased spending. The question defines standard of living as "all the things [they] can buy and do," so perhaps lower gas prices are freeing up dollars for Americans to spend on discretionary items.
While both political parties clamor for the credit of this post-recession glow, where the index will be heading from here is better to focus on. Because how Americans view their standard of living can crumple just as quickly as the economy.
Survey Methods
Results for this Gallup poll are based on telephone interviews conducted Dec. 1-30, 2014, on the Gallup U.S. Daily survey, with a random sample of 13,165 adults, aged 18 and older, living in all 50 U.S. states and the District of Columbia. For results based on the total sample of national adults, the margin of sampling error is ±2 percentage points at the 95% confidence level. All reported margins of sampling error include computed design effects for weighting.
Each sample of national adults includes a minimum quota of 50% cellphone respondents and 50% landline respondents, with additional minimum quotas by time zone within region. Landline and cellular telephone numbers are selected using random-digit-dial methods.
Learn more about how the Gallup U.S. Daily works.

