Story Highlights
- Sixth-year average is Obama's lowest
- His recent ratings have been higher; 24th-quarter average is up
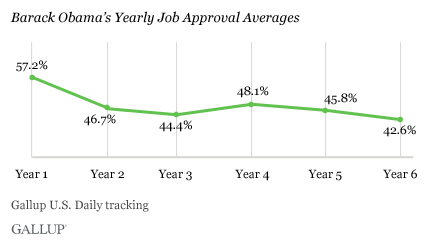
PRINCETON, N.J. -- President Barack Obama averaged a 42.6% job approval rating throughout his sixth full year in office, which ended Monday. Although his more recent ratings have been higher, including a 46% average rating last week, his sixth-year average is his lowest yearly rating to date.

These results are based on Gallup U.S. Daily tracking from Jan. 20, 2014, through Jan. 19, 2015. Obama begins his seventh year in office on Tuesday, also the day of his State of the Union address.
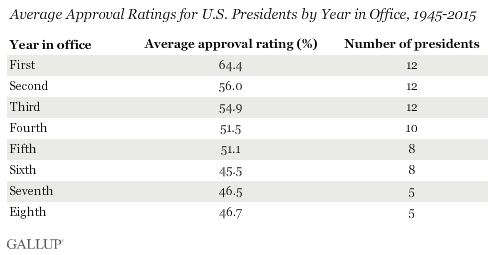
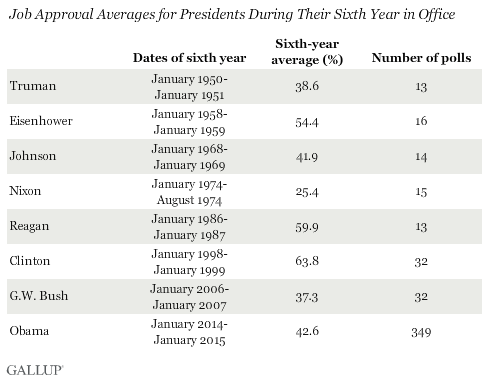
Presidents' sixth year in office has generally been unkind. Across all presidents, the sixth year is the one with the lowest overall average (45.5%), slightly worse than the seventh- and eighth-year averages. The sixth-year average is held down by Richard Nixon's very low sixth-year approval ratings up until he resigned from office in August 1974. Taking Nixon's numbers out of the mix, the sixth-year average would be 48.4%.

Of the six post-World War II presidents before Obama who served a full or partial sixth year in office, three had their worst yearly averages in year six: Dwight Eisenhower, Lyndon Johnson and Nixon.
Not all presidents have had difficult sixth years, though. Bill Clinton averaged 63.8% job approval and Ronald Reagan 59.9% as their sixth year coincided with periods of strong economic growth. Although it was his lowest yearly average of his eight-year presidency, Eisenhower still managed a relatively solid 54.4% approval rating in his sixth year.
But the presidents who were not popular in their sixth year tended to be very unpopular, including Harry Truman, George W. Bush and Nixon, who all averaged below 40% job approval.

Obama's Approval Ratings Trending Upward
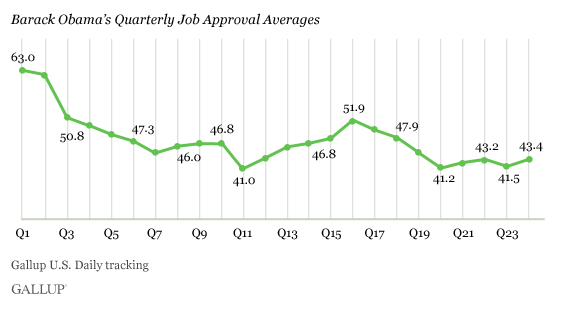
Even though Obama's sixth year in office was his worst to date, his approval ratings were showing signs of positive momentum in the latter stages of the year. For example, in the last three months of the year -- his 24th quarter in office -- his approval rating averaged 43.4%, up nearly two full percentage points from the prior quarter.

More recently, Obama's ratings have been even higher, averaging 46% job approval last week and the prior two weeks.
Obama's more positive recent approval ratings are likely influenced by two factors. The first is his decision to use executive actions to address the legal status of undocumented immigrants living in the U.S. This move, announced in a nationally televised address in November, was widely supported by Hispanics. In turn, Hispanics' overall approval rating of Obama climbed, and remains at that higher level today.
Secondly, Americans' assessments of the national economy are improving, and are at their highest levels since before the recession. All else being equal, Americans usually rate presidents better when the economy is strong.
Implications
President Obama certainly had a trying sixth year in office as he dealt with challenges abroad -- such as the rise of Islamic militants in the Middle East -- and faced continued partisan gridlock in trying to address key domestic issues. During the fall months, he registered some of the lowest approval ratings of his presidency. That culminated with Republicans' strong showing in the midterm elections, giving them solid majorities in both houses of Congress.
But since that time, aided by falling unemployment, plummeting gas prices and generally solid economic growth, as well as resurgent support from Hispanics, things have started to look up for Obama.
Historically, most presidents' seventh-year averages are lower than their sixth-year averages. If Obama's positive momentum continues throughout his seventh year in office, he would join Eisenhower as the only post-World War II presidents who saw significant improvement in support during their seventh year in office.
Survey Methods
Results for this Gallup poll are based on telephone interviews conducted Oct. 20, 2014, through Jan. 19, 2015, on the Gallup U.S. Daily survey, with a random sample of 42,603 adults, aged 18 and older, living in all 50 U.S. states and the District of Columbia.
For results based on the total sample of national adults, the margin of sampling error is ±1 percentage point at the 95% confidence level.
All reported margins of sampling error include computed design effects for weighting.
Each sample of national adults includes a minimum quota of 50% cellphone respondents and 50% landline respondents, with additional minimum quotas by time zone within region. Landline and cellular telephone numbers are selected using random-digit-dial methods.
Learn more about how the Gallup U.S. Daily works.

