Story Highlights
- Ranks among highest monthly averages in 2015
- Strongest October spending average since 2008
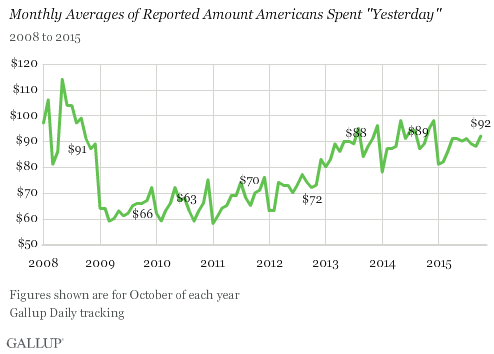
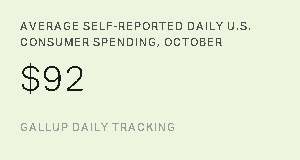
WASHINGTON, D.C. -- Americans' daily self-reports of spending averaged $92 in October, up $4 from September. This is just above the $81 to $91 range seen since January 2015.

Compared with Octobers in prior years, last month's $92 average is similar to readings from 2008 ($91), 2013 ($88) and 2014, but it is significantly higher than the October averages in 2009-2012, which ranged from $63 to $72.

Depending on November's spending figure, 2015 could follow the autumn spending pattern of the previous two years, as well as those of 2010 and 2011, in which spending increased in both October and November. Monthly averages fell dramatically in the fall months of 2008 as the global economic crisis was unfolding, and stagnated during this period in 2009 and 2012.
September-to-October changes have seen mixed results. In recent years, spending was slightly higher in October. In some years, such as 2009 and 2012, spending dipped slightly or was flat. In 2008, though, average daily spending fell $8 from September to October at the onset of the economic crisis.

Bottom Line
Americans spent more on average each day in October than in September this year, and the October average is among the highest in 2015 so far. Spending during the last three Octobers was higher than during previous Octobers going back to 2008.
November's spending average will be important to monitor. While spending increases are practically a given for the month of December, such increases are not guaranteed for November. However, Gallup has measured an October-November decline only once, in 2008, as the nation was reeling from the effects of the financial crisis. Other Gallup research shows that Americans are planning to spend more this year on Christmas presents than in recent years, suggesting that the October uptick could be another indicator of robust retail spending as 2015 draws to a close.
These data are available in Gallup Analytics.
Survey Methods
Results for this Gallup poll are based on telephone interviews conducted Oct. 1-31, 2015, on the Gallup U.S. Daily survey, with a random sample of 15,232 adults, aged 18 and older, living in all 50 U.S. states and the District of Columbia. The margin of error for the spending mean is ±$5. All reported margins of sampling error include computed design effects for weighting.
Each sample of national adults includes a minimum quota of 60% cellphone respondents and 40% landline respondents, with additional minimum quotas by time zone within region. Landline and cellular telephone numbers are selected using random-digit-dial methods.
Learn more about how the Gallup U.S. Daily works.
