Story Highlights
- Conservatives in U.S. are largest ideological group, at 37%
- Moderates close behind at 35%
- Liberals remain at high of 24%, first reached in 2014
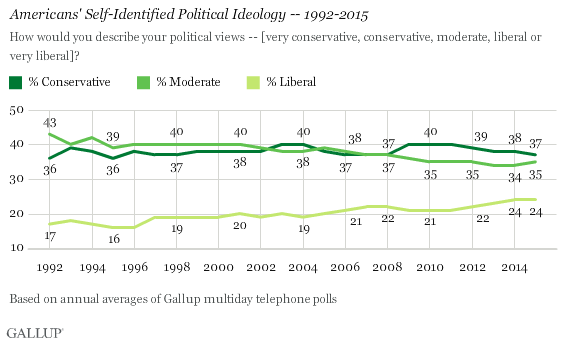
PRINCETON, N.J. -- Americans' political ideology remained essentially stable in the past year, with conservatives retaining the barest of advantages over moderates in Americans' self-identified political views, 37% vs. 35%. Liberals held firm at 24%.

Conservatives have outnumbered moderates as well as liberals in the U.S. population each year since 2009, coinciding with Barack Obama's presidency. Before that, spanning George W. Bush's presidency, from 2001 to 2008, the two groups were about tied. Through most of Bill Clinton's presidency, from 1993 to 2000, moderates had a slight edge.
The 2015 results are based on interviews with roughly 12,000 national adults conducted between January and December 2015 as part of Gallup's monthly Gallup Poll Social Series surveys.
There was a one-point drop in the percentage of U.S. adults identifying as conservative between 2014 and 2015, from 38% to 37%. While not statistically significant, it does continue the narrowing of the gap between conservatives and moderates Gallup has seen since 2011. Meanwhile, with the percentage identifying as liberal increasing from 21% in 2011 to 24% in each of the past two years, conservatives' advantage over liberals has been cut sharply.
Gallup measures ideology by asking Americans to say whether their political views are very conservative, conservative, moderate, liberal or very liberal. The total of 37% calling themselves conservative today reflects 28% calling themselves "conservative" and 9% "very conservative." The 24% who are liberal includes 18% who are "liberal" and 6% who are "very liberal."
Democrats' Shift to the Left Continues
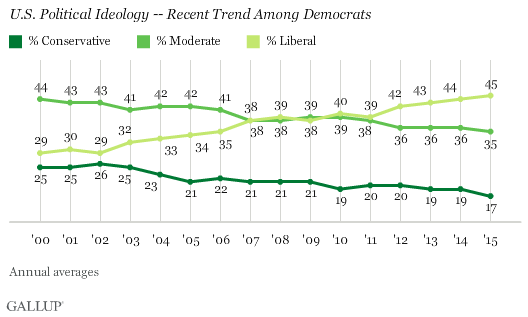
The expansion in the percentage of liberals over the past five years has been most evident among adults who identify with the Democratic Party, rising from 39% in 2011 to 45% in 2015. Longer-term, the percentage of Democrats calling themselves liberal has climbed 16 percentage points from 29% in 2000, while the percentages who are "moderate" and "conservative" have both declined.
From 2000 to 2003, moderates were the largest ideological group among Democrats, followed by sizable proportions identifying as liberal and conservative. Since 2012, however, liberals have been the largest group, with a sizable moderate component and a significantly smaller conservative component.

Republicans Remain Mostly Conservative
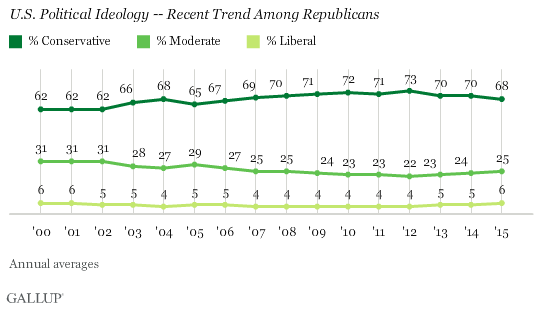
Over the past two decades, Republicans have consistently been a more homogenous party than the Democrats, with the majority calling themselves conservative and most of the rest identifying as moderate. No more than 6% in any year has self-defined as liberal.
The conservative faction within Republicans swelled to 70% or more between 2008 and 2014. While not statistically significant, the drop to 68% in 2015 is nevertheless notable for breaking the pattern and bears watching in 2016.

Independents Still Diverse, but With Dwindling Moderate Faction
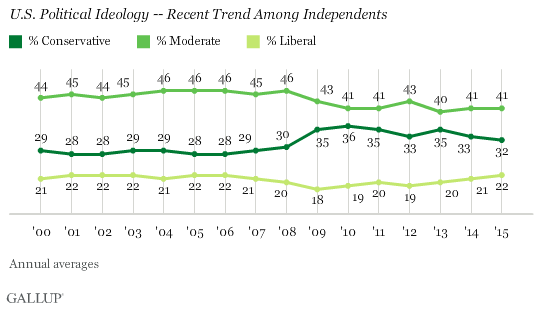
Independents are naturally the most diverse of the three main political groups, with the bulk (41%) calling themselves moderate and substantial segments identifying as conservative (32%) or liberal (22%). This has largely been the case since 2000, but some shifts began to occur in 2009. After hitting a low of 18% that year, a steadily rising proportion have identified themselves as liberal, and fewer as moderates, while the percentage of conservatives initially grew from 30% to 36%, but has recently slipped back to 32%.

Bottom Line
The ideological bent of U.S. adults changed little in 2015, although Democrats continued to inch to the left. This continues a significant long-term trend, with a slight increase in Americans favoring the liberal label, mostly at the expense of conservatives. While conservatives still outnumber liberals by a healthy margin in the U.S. population, the gap is narrower than at any point in Gallup's 23-year trend. It is also possible that after several years of heightened conservatism among Republicans and independents, this is moderating somewhat, but it is too early to say for sure.
Historical data are available in Gallup Analytics.
Survey Methods
Results are based on aggregated telephone interviews from 15 separate Gallup polls conducted in 2015, with a random sample of 12,137 adults, aged 18 and older, living in all 50 U.S. states and the District of Columbia.
For results based on the total sample of national adults, the margin of sampling error is ±1 percentage point at the 95% confidence level.
Each sample of national adults includes a minimum quota of 50% cellphone respondents and 50% landline respondents, with additional minimum quotas by time zone within region. Landline and cellular telephone numbers are selected using random-digit-dial methods.
Learn more about how Gallup Poll Social Series works.


