Story Highlights
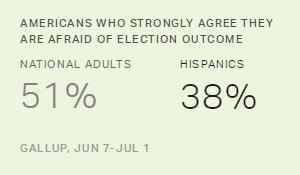
- 38% of Hispanics strongly agree they are afraid of election outcome
- 64% of blacks, 53% of whites strongly agree they fear the outcome
- Fewer Hispanics than whites, blacks strongly agree stakes are higher
WASHINGTON, D.C. -- Despite Donald Trump's harsh anti-immigration rhetoric throughout this year's presidential campaign, Hispanics are less likely than either whites or blacks to "strongly agree" that they are afraid of what will happen if their candidate loses. Hispanics also are less likely to agree that the stakes in this year's presidential election are higher than usual.
| Strongly agree | Somewhat agree | Somewhat disagree | Strongly disagree | |||||||||||||||||||||||||||||||||||||||||||||||||||||||||||||||||||||||||||||||||||||||||||||||||
|---|---|---|---|---|---|---|---|---|---|---|---|---|---|---|---|---|---|---|---|---|---|---|---|---|---|---|---|---|---|---|---|---|---|---|---|---|---|---|---|---|---|---|---|---|---|---|---|---|---|---|---|---|---|---|---|---|---|---|---|---|---|---|---|---|---|---|---|---|---|---|---|---|---|---|---|---|---|---|---|---|---|---|---|---|---|---|---|---|---|---|---|---|---|---|---|---|---|---|---|---|
| % | % | % | % | |||||||||||||||||||||||||||||||||||||||||||||||||||||||||||||||||||||||||||||||||||||||||||||||||
| The stakes in this presidential election are higher than in previous years. | ||||||||||||||||||||||||||||||||||||||||||||||||||||||||||||||||||||||||||||||||||||||||||||||||||||
| All | 61 | 24 | 9 | 5 | ||||||||||||||||||||||||||||||||||||||||||||||||||||||||||||||||||||||||||||||||||||||||||||||||
| Blacks | 66 | 20 | 6 | 5 | ||||||||||||||||||||||||||||||||||||||||||||||||||||||||||||||||||||||||||||||||||||||||||||||||
| Hispanics | 50 | 30 | 11 | 6 | ||||||||||||||||||||||||||||||||||||||||||||||||||||||||||||||||||||||||||||||||||||||||||||||||
| Non-Hispanic whites | 63 | 24 | 8 | 5 | ||||||||||||||||||||||||||||||||||||||||||||||||||||||||||||||||||||||||||||||||||||||||||||||||
| I am afraid of what will happen if my candidate for president does not win. | ||||||||||||||||||||||||||||||||||||||||||||||||||||||||||||||||||||||||||||||||||||||||||||||||||||
| All | 51 | 21 | 13 | 10 | ||||||||||||||||||||||||||||||||||||||||||||||||||||||||||||||||||||||||||||||||||||||||||||||||
| Blacks | 64 | 13 | 9 | 11 | ||||||||||||||||||||||||||||||||||||||||||||||||||||||||||||||||||||||||||||||||||||||||||||||||
| Hispanics | 38 | 31 | 14 | 12 | ||||||||||||||||||||||||||||||||||||||||||||||||||||||||||||||||||||||||||||||||||||||||||||||||
| Non-Hispanic whites | 53 | 20 | 13 | 10 | ||||||||||||||||||||||||||||||||||||||||||||||||||||||||||||||||||||||||||||||||||||||||||||||||
| Gallup, June 7-July 1 | ||||||||||||||||||||||||||||||||||||||||||||||||||||||||||||||||||||||||||||||||||||||||||||||||||||
Large majorities of all three major U.S. racial and ethnic groups agree the election stakes are higher this year than in prior years, with 66% of blacks, 63% of whites and 50% of Hispanics strongly agreeing. And while roughly seven in 10 or more of each group agree they are afraid of what will happen if their candidate does not win, 64% of blacks, compared with 53% of whites and only 38% of Hispanics, strongly agree.
U.S.-Born Hispanics More Concerned Than Hispanic Immigrants About Election
Hispanic immigrants account for most of the differences between the views of Hispanics and those of blacks and non-Hispanic whites. Sixty-nine percent of native-born Hispanics strongly agree that this year's election stakes are higher than usual, compared with 31% of Hispanic immigrants. Forty-five percent of Hispanics born in the U.S. strongly agree they are afraid of what will happen if their candidate for president does not win, compared with 30% of Hispanic immigrants.
Hispanics have been less likely than other racial or ethnic groups to vote in recent elections. The Democratic Party, which typically garners strong support from Hispanics who do vote, has mounted a major drive this year to build interest and increase the number of Hispanics registered to vote.
Among U.S.-born Hispanics, 87% say they are registered to vote, slightly less than the 93% of non-Hispanic whites who are registered to vote. Among Hispanic immigrants, 28% say they are registered, and another 27% plan to register before the election.
Younger Blacks, Black Women Most Afraid of Election Outcome
Almost three in four black women (72%) strongly agree that they are afraid of what will happen if their candidate loses, compared with 55% of black men. The gender gap is smaller among whites and virtually non-existent among Hispanics.
| Strongly agree | Somewhat agree | Somewhat disagree | Strongly disagree | ||||||||||||||||||||||||||||||||||||||||||||||||||||||||||||||||||||||||||||||||||||||||||||||||
|---|---|---|---|---|---|---|---|---|---|---|---|---|---|---|---|---|---|---|---|---|---|---|---|---|---|---|---|---|---|---|---|---|---|---|---|---|---|---|---|---|---|---|---|---|---|---|---|---|---|---|---|---|---|---|---|---|---|---|---|---|---|---|---|---|---|---|---|---|---|---|---|---|---|---|---|---|---|---|---|---|---|---|---|---|---|---|---|---|---|---|---|---|---|---|---|---|---|---|---|
| % | % | % | % | ||||||||||||||||||||||||||||||||||||||||||||||||||||||||||||||||||||||||||||||||||||||||||||||||
| Black men | 55 | 12 | 15 | 16 | |||||||||||||||||||||||||||||||||||||||||||||||||||||||||||||||||||||||||||||||||||||||||||||||
| Black women | 72 | 14 | 4 | 7 | |||||||||||||||||||||||||||||||||||||||||||||||||||||||||||||||||||||||||||||||||||||||||||||||
| Hispanic men | 36 | 26 | 18 | 14 | |||||||||||||||||||||||||||||||||||||||||||||||||||||||||||||||||||||||||||||||||||||||||||||||
| Hispanic women | 39 | 35 | 10 | 11 | |||||||||||||||||||||||||||||||||||||||||||||||||||||||||||||||||||||||||||||||||||||||||||||||
| Non-Hispanic white men | 49 | 22 | 13 | 11 | |||||||||||||||||||||||||||||||||||||||||||||||||||||||||||||||||||||||||||||||||||||||||||||||
| Non-Hispanic white women | 56 | 18 | 12 | 9 | |||||||||||||||||||||||||||||||||||||||||||||||||||||||||||||||||||||||||||||||||||||||||||||||
| Gallup, June 7-July 1 | |||||||||||||||||||||||||||||||||||||||||||||||||||||||||||||||||||||||||||||||||||||||||||||||||||
Although younger blacks (71%) are more likely than those who are older (54%) to strongly agree they are afraid of the election outcome, the reverse is true among Hispanics and whites -- older Hispanics and whites express the most fear.
| Strongly agree | Somewhat agree | Somewhat disagree | Strongly disagree | ||||||||||||||||||||||||||||||||||||||||||||||||||||||||||||||||||||||||||||||||||||||||||||||||
|---|---|---|---|---|---|---|---|---|---|---|---|---|---|---|---|---|---|---|---|---|---|---|---|---|---|---|---|---|---|---|---|---|---|---|---|---|---|---|---|---|---|---|---|---|---|---|---|---|---|---|---|---|---|---|---|---|---|---|---|---|---|---|---|---|---|---|---|---|---|---|---|---|---|---|---|---|---|---|---|---|---|---|---|---|---|---|---|---|---|---|---|---|---|---|---|---|---|---|---|
| % | % | % | % | ||||||||||||||||||||||||||||||||||||||||||||||||||||||||||||||||||||||||||||||||||||||||||||||||
| Blacks ages 18-49 | 71 | 12 | 8 | 9 | |||||||||||||||||||||||||||||||||||||||||||||||||||||||||||||||||||||||||||||||||||||||||||||||
| Black ages 50 and older | 54 | 15 | 11 | 15 | |||||||||||||||||||||||||||||||||||||||||||||||||||||||||||||||||||||||||||||||||||||||||||||||
| Hispanics ages 18-49 | 33 | 36 | 13 | 12 | |||||||||||||||||||||||||||||||||||||||||||||||||||||||||||||||||||||||||||||||||||||||||||||||
| Hispanics ages 50 and older | 48 | 20 | 14 | 13 | |||||||||||||||||||||||||||||||||||||||||||||||||||||||||||||||||||||||||||||||||||||||||||||||
| Whites (non-Hispanic) ages 18-49 | 49 | 23 | 14 | 10 | |||||||||||||||||||||||||||||||||||||||||||||||||||||||||||||||||||||||||||||||||||||||||||||||
| Whites (non-Hispanic) ages 50 and older | 56 | 18 | 11 | 10 | |||||||||||||||||||||||||||||||||||||||||||||||||||||||||||||||||||||||||||||||||||||||||||||||
| Gallup, June 7-July 1 | |||||||||||||||||||||||||||||||||||||||||||||||||||||||||||||||||||||||||||||||||||||||||||||||||||
Combining all races and ethnicities, Democrats (63%) are more likely than Republicans (53%) to strongly agree that they are afraid of what will happen if their candidate loses the election.
Bottom Line
Strong majorities of whites, blacks and Hispanics agree the stakes are high in the 2016 presidential election, and that they have reason be worried if their candidate loses. The two groups that mostly vote Democratic -- blacks and Hispanics -- seem, on the surface, to have widely differing views, but the differences almost dissolve when considering only native-born Hispanics. Non-Hispanic whites, who are more likely to be Republican, show similar levels of concern about the outcome of the election.
In less than a month, both Republicans and Democrats will have held their party's national convention and nominated their candidates. The tone at each of those events will give a preview of how much the fall campaigns will aim to capitalize on the fears most Americans have about the consequences if their candidate loses.
Survey Methods
Results for this Gallup poll are based on telephone interviews conducted June 7-July 1, 2016, with a sample of 3,270 adults, aged 18 and older, living in all 50 U.S. states and the District of Columbia, who had previously been interviewed in the Gallup Daily tracking poll and agreed to be re-interviewed for a later study. The sample is weighted to be representative of U.S. adults.
For results based on the total sample of national adults, the margin of sampling error is ±3 percentage points at the 95% confidence level. For results based on the sample of 1,320 non-Hispanic whites, the margin of sampling error is ±4 percentage points at the 95% confidence level. For results based on the sample of 912 non-Hispanic blacks, the margin of sampling error is ±5 percentage points at the 95% confidence level. For results based on the sample of 906 Hispanics, the margin of sampling error is ±6 percentage points at the 95% confidence level. (271 out of the 906 interviews with Hispanics were conducted in Spanish.)
All reported margins of sampling error include computed design effects for weighting.
Learn more about how the Gallup Poll Social Series works.