Story Highlights
- Clinton's favorability among Democrats up three points since June 5
- Trump's favorability among Republicans holds at improved level in June
- Trump has made gains among GOP each of the past two weeks
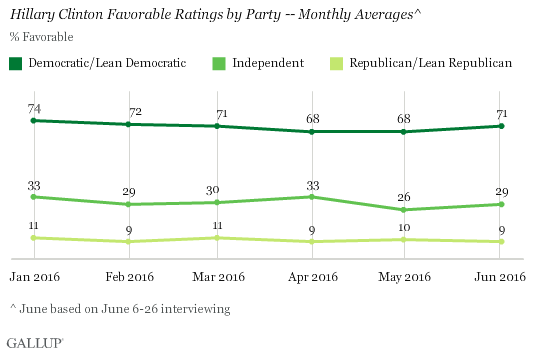
PRINCETON, N.J. -- Since clinching the Democratic nomination in early June, Hillary Clinton's favorable rating among Democrats and Democratic-leaning independents is up slightly to 71%, compared with 68% in April and May. Her image is now partly restored to what it was at the start of the year when 74% of Democrats viewed her favorably.

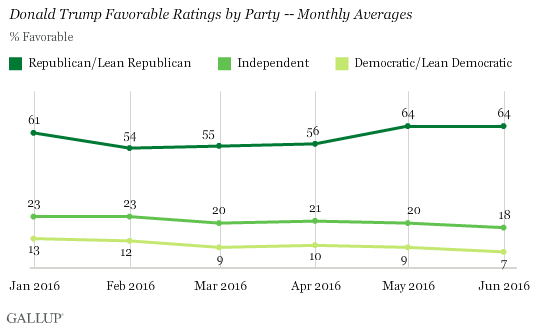
Meanwhile, Donald Trump has maintained higher favorable ratings among Republicans and Republican leaners since he emerged as the sole Republican candidate in May compared with earlier in the year. His favorable rating among Republicans averages 64% so far in June, the same as in May but higher than the 54% to 56% in the three prior months. His current favorable rating also exceeds the average 61% he earned from this partisan group in January.

At the same time, Clinton and Trump have each lost ground over the course of 2016 among independents who lean toward neither party. Because of this, the candidates' national favorable ratings have stayed still or declined slightly, despite recent improved ratings from their own partisans. Clinton's overall favorable rating since clinching the nomination has averaged 41%, nearly matching her 40% in May but down slightly from 44% in January. Trump's average 31% thus far in June compares with 32% in May and 34% in January. However, the electoral importance of pure independents will likely be muted, as Gallup polling traditionally shows this group to be less engaged in politics and less likely to vote than those who identify with or lean toward one of the two major parties.
Additionally, the percentage of Democrats viewing Trump favorably has dwindled from 13% in January to 10% in April and 7% in June, also contributing to the decline in his overall favorable rating nationally. The percentage of Republicans viewing Clinton favorably has been steady, near 10%.
2016 Nominees Less Liked by Own Parties Than Their Predecessors
Although Clinton leads Trump in overall favorability thus far in June, she remains well behind the last several Democratic nominees, two of whom garnered 87% favorability among Democrats in June of their election years. Only Al Gore in June 2000 fell below that range, at 77%. Clinton's 9% average favorable rating from Republicans in June is also far lower than what most prior Democratic nominees have earned, although not too much lower than President Barack Obama's in 2012.
| Democratic/Lean Democratic | Republican/Lean Republican | ||||||||||||||||||||||||||||||||||||||||||||||||||||||||||||||||||||||||||||||||||||||||||||||||||
|---|---|---|---|---|---|---|---|---|---|---|---|---|---|---|---|---|---|---|---|---|---|---|---|---|---|---|---|---|---|---|---|---|---|---|---|---|---|---|---|---|---|---|---|---|---|---|---|---|---|---|---|---|---|---|---|---|---|---|---|---|---|---|---|---|---|---|---|---|---|---|---|---|---|---|---|---|---|---|---|---|---|---|---|---|---|---|---|---|---|---|---|---|---|---|---|---|---|---|---|
| % | % | ||||||||||||||||||||||||||||||||||||||||||||||||||||||||||||||||||||||||||||||||||||||||||||||||||
| 2016: Hillary Clinton | 71 | 9 | |||||||||||||||||||||||||||||||||||||||||||||||||||||||||||||||||||||||||||||||||||||||||||||||||
| 2012: Barack Obama | 88 | 15 | |||||||||||||||||||||||||||||||||||||||||||||||||||||||||||||||||||||||||||||||||||||||||||||||||
| 2008: Barack Obama | 87 | 37 | |||||||||||||||||||||||||||||||||||||||||||||||||||||||||||||||||||||||||||||||||||||||||||||||||
| 2004: John Kerry | 87 | 28 | |||||||||||||||||||||||||||||||||||||||||||||||||||||||||||||||||||||||||||||||||||||||||||||||||
| 2000: Al Gore | 77 | 25 | |||||||||||||||||||||||||||||||||||||||||||||||||||||||||||||||||||||||||||||||||||||||||||||||||
| Note: 2012 results for Barack Obama based on May 10-13 survey | |||||||||||||||||||||||||||||||||||||||||||||||||||||||||||||||||||||||||||||||||||||||||||||||||||
| Gallup | |||||||||||||||||||||||||||||||||||||||||||||||||||||||||||||||||||||||||||||||||||||||||||||||||||
Clinton's favorability problems are not necessarily a liability for her given that Trump fares even worse than her and relative to his Republican predecessors. The 64% of Republicans viewing Trump favorably in June is nearly 20 percentage points lower than any of the prior recent Republican nominees. And his 7% rating among Democrats and Democratic leaners in June is markedly lower than the crossover favorability that prior Republican nominees have earned.
| Republican/Lean Republican | Democratic/Lean Democratic | ||||||||||||||||||||||||||||||||||||||||||||||||||||||||||||||||||||||||||||||||||||||||||||||||||
|---|---|---|---|---|---|---|---|---|---|---|---|---|---|---|---|---|---|---|---|---|---|---|---|---|---|---|---|---|---|---|---|---|---|---|---|---|---|---|---|---|---|---|---|---|---|---|---|---|---|---|---|---|---|---|---|---|---|---|---|---|---|---|---|---|---|---|---|---|---|---|---|---|---|---|---|---|---|---|---|---|---|---|---|---|---|---|---|---|---|---|---|---|---|---|---|---|---|---|---|
| % | % | ||||||||||||||||||||||||||||||||||||||||||||||||||||||||||||||||||||||||||||||||||||||||||||||||||
| 2016: Donald Trump | 64 | 7 | |||||||||||||||||||||||||||||||||||||||||||||||||||||||||||||||||||||||||||||||||||||||||||||||||
| 2012: Mitt Romney | 82 | 20 | |||||||||||||||||||||||||||||||||||||||||||||||||||||||||||||||||||||||||||||||||||||||||||||||||
| 2008: John McCain | 88 | 37 | |||||||||||||||||||||||||||||||||||||||||||||||||||||||||||||||||||||||||||||||||||||||||||||||||
| 2004: George W. Bush | 94 | 21 | |||||||||||||||||||||||||||||||||||||||||||||||||||||||||||||||||||||||||||||||||||||||||||||||||
| 2000: George W. Bush | 88 | 36 | |||||||||||||||||||||||||||||||||||||||||||||||||||||||||||||||||||||||||||||||||||||||||||||||||
| Note: 2012 results for Mitt Romney based on May 10-13 survey | |||||||||||||||||||||||||||||||||||||||||||||||||||||||||||||||||||||||||||||||||||||||||||||||||||
| Gallup | |||||||||||||||||||||||||||||||||||||||||||||||||||||||||||||||||||||||||||||||||||||||||||||||||||
One bright spot for Trump is that his average favorable rating from Republicans in June reflects improving scores on a weekly basis, rising from 60% for June 6-12 to 64% for June 13-19 and 67% for June 20-26. Over the same period, Clinton's weekly scores among Democrats were flat, registering 72%, 70% and 71%.
Bottom Line
Despite steady or even sagging ratings nationally, Trump and Clinton have begun the process of repairing their images within their own parties as they prepare to receive their nominations in July. Eliminating their challengers for the nomination may have been the first step in having their own party members view them more favorably. Shifting gears to a general election mode will be the next step, and the national party conventions next month should maximize whatever support the candidates will receive from their own parties' supporters nationally.
While Clinton may have earned a bump from clinching the Democratic nomination in early June, she has not built on that in the following weeks, perhaps because of Bernie Sanders' reluctance to withdraw from the race and endorse her. Trump, on the other hand, has picked up some additional steam among Republicans in June. However, advancing on a weekly basis is one thing -- maintaining those gains on a monthly basis is another. It will be important to see if Trump can hold or build on his improved status among Republicans into July.
Historical data are available in Gallup Analytics.
Survey Methods
Results for this Gallup analysis are based on telephone interviews conducted Jan. 2-June 26, 2016, on the Gallup U.S. Daily survey with random samples of U.S. adults, aged 18 and older, living in all 50 U.S. states and the District of Columbia. Each candidate's monthly ratings are based on at least 4,000 U.S. adults, including at least 1,700 adults aligned with or leaning toward the Republican and Democratic Parties and at least 400 pure independents.
For monthly results based on the total sample of national adults, the margin of sampling error is no more than ±2 percentage points at the 95% confidence level. For monthly results based on Democrats and independents who lean Democratic as well as Republicans and independents who lean Republican, the margin of sampling error is no more than ±3 percentage points at the 95% confidence level. All reported margins of sampling error include computed design effects for weighting.
Each sample of national adults includes a minimum quota of 60% cellphone respondents and 40% landline respondents, with additional minimum quotas by time zone within region. Landline and cellular telephone numbers are selected using random-digit-dial methods.
Learn more about how the Gallup U.S. Daily works.


