Story Highlights
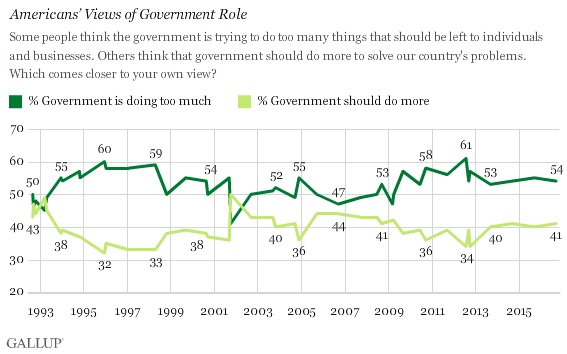
- 54% of Americans say the government is trying to do too many things
- About four in 10 say the government should do more to solve problems
- Republicans and Democrats continue to have widely divergent views
PRINCETON, N.J. -- One of the fundamental questions that have divided the U.S. this election year -- and, in fact, since its founding 240 years ago -- concerns the appropriate role of the federal government. A new update of a longstanding Gallup trend shows that Americans continue to favor a smaller role for government, with 54% saying the government is attempting to do too many things that should be left to individuals and businesses, and 41% saying it should do more to solve the country's problems.

With a few exceptions, the current results are typical of Americans' responses since 1992. One exception was in late 1992 and early 1993 as Bill Clinton campaigned for and took over the presidency. At that time, Americans were highly concerned about the economy. The second exception occurred in October 2001, just after the Sept. 11 terrorist attacks, when Americans were focused on the government's response to the most significant domestic terrorist attack in the country's history. Otherwise, across more than 40 surveys over 25 years, including the most recent Sept. 7-11 update, the public has tilted by at least a small margin toward believing that the government is trying to do too much.
The margin between "doing too much" and "should do more" was somewhat larger during the last seven years of the Clinton administration and the entire Barack Obama presidency than in the George W. Bush years. This most likely reflects a counteraction to perceptions that the two Democratic presidents were oriented toward increasing the government's role.
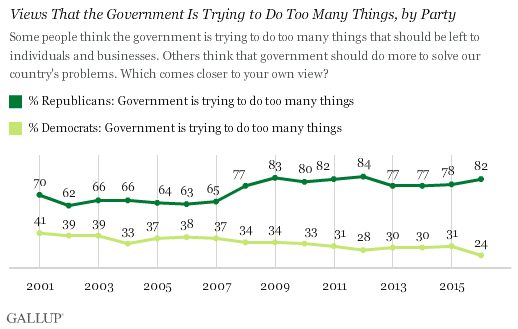
These broad general population trends mask the fact that Republicans and Democrats have widely divergent views on the issue, consistent with each party's philosophy on the role of government. Republicans overwhelmingly favor the "doing too much" option, and Democrats are almost as likely to favor "should do more."
The accompanying graph shows the trends in the views of Republicans and Democrats compiled from 16 annual Gallup Governance surveys conducted each September since 2001. The graph shows the percentage of each party choosing the "doing too much" option (a display of partisan differences on the alternative option would show, in essence, a mirror image).

It's clear that Republicans' choice of the conservative viewpoint edged up in 2008 as the financial crisis took hold and the Bush administration struggled to right the economy, while Democrats' choice of that option began to edge down. The overall gap between the views of the two partisan groups on this measure went from the 30-percentage-point range to a high of 58 points in the latest survey.
Differences in these views across other segments of the U.S. population are generally related to the political orientation of each segment. Women, minorities and young adults are more likely to be Democrats and are least likely to say the government is doing too many things that should be left to individuals and businesses.
The details of the differences in these attitudes across racial and ethnic population segments are worth highlighting. Blacks' and Hispanics' views of what government's role should be are almost exactly the opposite of those of non-Hispanic whites, helping clarify at least one reason why race and ethnicity are such powerful determinants of support for Hillary Clinton and Donald Trump in the presidential election.
| Government is doing too much | Government should do more | ||||||||||||||||||||||||||||||||||||||||||||||||||||||||||||||||||||||||||||||||||||||||||||||||||
|---|---|---|---|---|---|---|---|---|---|---|---|---|---|---|---|---|---|---|---|---|---|---|---|---|---|---|---|---|---|---|---|---|---|---|---|---|---|---|---|---|---|---|---|---|---|---|---|---|---|---|---|---|---|---|---|---|---|---|---|---|---|---|---|---|---|---|---|---|---|---|---|---|---|---|---|---|---|---|---|---|---|---|---|---|---|---|---|---|---|---|---|---|---|---|---|---|---|---|---|
| % | % | ||||||||||||||||||||||||||||||||||||||||||||||||||||||||||||||||||||||||||||||||||||||||||||||||||
| Non-Hispanic white | 62 | 32 | |||||||||||||||||||||||||||||||||||||||||||||||||||||||||||||||||||||||||||||||||||||||||||||||||
| Black | 29 | 65 | |||||||||||||||||||||||||||||||||||||||||||||||||||||||||||||||||||||||||||||||||||||||||||||||||
| Hispanic | 33 | 63 | |||||||||||||||||||||||||||||||||||||||||||||||||||||||||||||||||||||||||||||||||||||||||||||||||
| Aggregated Gallup Polls conducted 2013-2016 | |||||||||||||||||||||||||||||||||||||||||||||||||||||||||||||||||||||||||||||||||||||||||||||||||||
| Gallup | |||||||||||||||||||||||||||||||||||||||||||||||||||||||||||||||||||||||||||||||||||||||||||||||||||
Bottom Line
Republican candidate Trump has not made smaller government a major part of his campaign rhetoric -- certainly not in the way it became a centerpiece of the campaign of his chief competitor for the nomination, Ted Cruz, who called for shutting down whole departments and federal agencies. Still, if Trump is elected, it would be expected that the number of Republicans saying the government is trying to do too much would drop, at least marginally.
Democratic candidate Clinton's governing philosophy as president is likely to be similar in many ways to Obama's, with an underlying faith in the idea of using and expanding the government to right wrongs and ameliorate society's problems. If she is elected, the type of gap found now between the two partisan groups' views on the government's role would most likely stay large.
Historical data are available in Gallup Analytics.
Survey Methods
Results for this Gallup poll are based on telephone interviews conducted Sept. 7-11, 2016, with a random sample of 1,020 adults, aged 18 and older, living in all 50 U.S. states and the District of Columbia. For results based on the total sample of national adults, the margin of sampling error is ±4 percentage points at the 95% confidence level. All reported margins of sampling error include computed design effects for weighting.
Each sample of national adults includes a minimum quota of 60% cellphone respondents and 40% landline respondents, with additional minimum quotas by time zone within region. Landline and cellular telephone numbers are selected using random-digit-dial methods.
Learn more about how the Gallup Poll Social Series works.


