Story Highlights
- 29% of Americans have positive views of federal government
- Republicans' positive views are up; Democrats' views are down
- Republicans and Democrats now have similar views of government
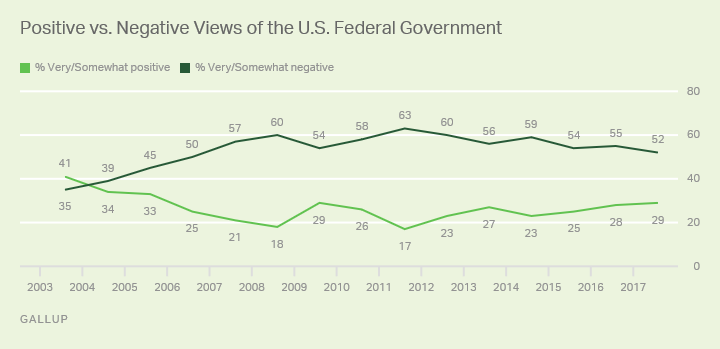
WASHINGTON, D.C. -- Americans' views of the federal government have become slightly more positive over the past few years. Despite this improvement, less than a third of U.S. adults currently say they view the federal government in a favorable light. The latest 29% who say they view the government "very" or "somewhat" positively is among the highest ratings recorded since 2009, up from the 17% recorded in 2011 and 23% in 2014.

These current views of the federal government, recorded in an Aug. 2-6 Gallup poll, are tied with where they were in 2009, President Barack Obama's first year in office. Readings from 2009 and 2017 represent the highest positive ratings since 2005, with considerable fluctuation in these attitudes over the years, including low points of 18% and 17% in 2008 and 2011, respectively. Views were most positive in 2003, the first year Gallup asked this question, most likely reflecting a continuation of Americans' post-9/11 "rally" around their government.
Despite the slight rise in positive attitudes seen over the past few years, Americans remain much more likely to have "somewhat" or "very" negative views of the federal government (52% this year), while about one in five are neutral (19%). Negative views of the government have outweighed positive views in all but Gallup's first poll in 2003.
From a comparative perspective, the federal government maintains the lowest positive rating of any of the 25 business or industry sectors tested in the August survey, ranking slightly below the pharmaceutical industry's 33%.
Republicans, Democrats Now Have Similar Views of Government
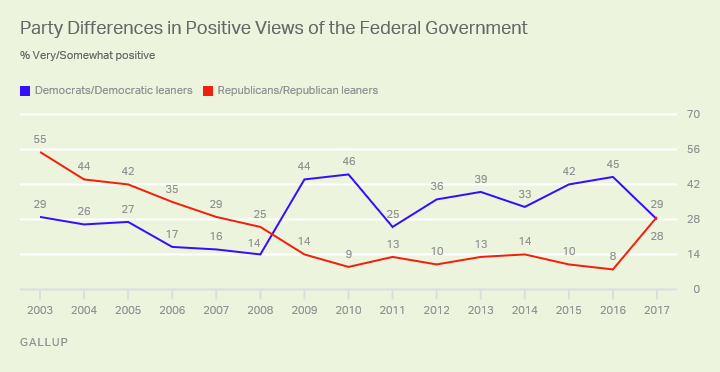
Throughout the first 14 years that Gallup tracked these general attitudes toward the federal government, Republicans and Democrats held significantly different views, directly related to the party of the president. During the George W. Bush years, Republicans were more positive; during the Obama years, Democrats were more positive. The two groups' positive ratings have differed by at least 11 percentage points in all polls since 2003.
As expected, given the change from a Democratic to a Republican president, Democrats' positive views of the federal government have dropped 17 points from last year's 45%, while Republicans' positive views have increased by 21 points since 2016. These changes are similar to the shifts seen in 2009 when Obama became president, although in the opposite direction.
However, the baselines preceding the changes are different this year. Before 2009, there was an 11-point gap in positive views, but before this year, the gap was a much larger 37 points. Thus, the predictable shift in views of government this year -- as a result of the flip in control of the White House -- has just managed to bring the two groups' views into alignment.

Despite the drop this year, Democrats retain a higher degree of positivity now than they did in Bush's final years. Republicans' positive views of government, on the other hand, have returned to about the same level as in Bush's final two years (although much higher than at any point during the Obama years). Thus, the similarity in views of the government among the two party groups -- rather than Republicans holding a more positive view, as would be predicted given the Republican president -- appears to be more a result of Democrats' views than anything else.
Democrats' more positive view of the government compared with 2008 is certainly not the result of their more favorable opinion of the president. Democrats' job approval ratings for Donald Trump are in the single digits, generally similar to their views of Bush in the last three years of his administration. Additionally, Democrats don't control either house of Congress, eliminating that as a factor in their relatively higher ratings of the government. It is possible that Democrats' views of government at least partially reflect their belief in the importance of government to perform needed functions regardless of who is president, or an enhanced belief that government's checks and balances will function to help control what the Republican president might do.
Bottom Line
Republicans certainly have reason to be more positive and confident in the federal government in 2017, as their party has taken control of the White House, retained control of Congress and secured the confirmation of a Supreme Court justice. And, as would be predicted, their views have improved significantly from last year when Obama was still in the White House.
Democrats have reason to be more negative about the government, given Trump's election and their minority status in Congress. And Democrats' views of government have soured. But the two groups' views were so far apart last year -- tied as the biggest partisan gap since 2003 -- that the shifts have merely brought Democrats' and Republicans' views into parity, rather than put Republicans in a position where they are more positive.
Whatever the pattern of partisan differences in views of the government, one fact remains: The majority of Americans, regardless of party identification, have negative views of their federal government -- attitudes that are reflected in the similarly low percentages who approve of the job the president and Congress are doing at this point in history.

Gallup Analytics
Subscribe to our online platform and access nearly a century of primary data.
Survey Methods
Results for this Gallup poll are based on telephone interviews conducted Aug. 2-6, 2017, with a random sample of 529 adults, aged 18 and older, living in all 50 U.S. states and the District of Columbia. For results based on the total sample of national adults, the margin of sampling error is ±5 percentage points at the 95% confidence level. For results based on the total sample of 235 Republicans and Republican-leaning independents, the margin of sampling error is ±8 percentage points at the 95% confidence level. For results based on the total sample of 224 Democrats and Democratic-leaning independents, the margin of sampling error is ±8 percentage points at the 95% confidence level. All reported margins of sampling error include computed design effects for weighting.
Each sample of national adults includes a minimum quota of 70% cellphone respondents and 30% landline respondents, with additional minimum quotas by time zone within region. Landline and cellular telephone numbers are selected using random-digit-dial methods.
Learn more about how the Gallup Poll Social Series works.


