Story Highlights
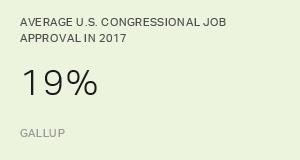
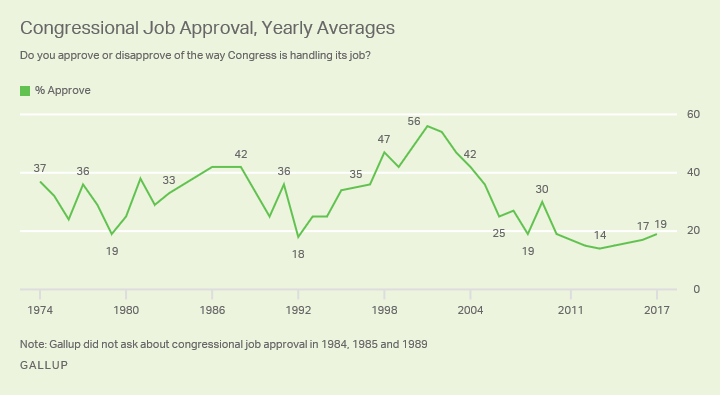
- Average 2017 Congress approval is 19%, slight uptick from 17% in 2016
- Republicans' average is highest since 2006; Democrats' is lowest in 25 years
- Yearly averages have been below 20% for eight consecutive years
WASHINGTON, D.C. -- Americans' approval of Congress averaged 19% in 2017, a slight uptick from readings in recent years, but still among the lowest historically. This year's average rating marks the eighth consecutive year in which less than 20% of Americans have approved of Congress.
The public's frustration with government and its leaders has been festering for much of the past decade, and low congressional approval is just one of many manifestations of the public's dissatisfaction with Washington.
Gallup's yearly congressional job approval averages reflect ratings measured every month since 2001 and periodic ratings before that. Gallup's most recent monthly congressional approval rating, 17%, from a Dec. 4-11 poll, marks a slight uptick from the 13% reading last month. Republican approval climbed to 29% in December from 18% in November after passage of versions of the party's sweeping tax legislation in both houses of Congress. However, this is well below the 50% job approval rating Republicans gave Congress in February, after Donald Trump's inauguration. While that high level of Republican approval quickly eroded, it pushed overall congressional approval to 28%.
The current annual average is well below Gallup's overall historical 31% average measured across all years since 1974. The highest yearly approval average, 56% in 2001, followed the 9/11 terrorist attacks when Americans rallied around government leaders. The lowest annual average, 14% in 2013, came when Congress' failure to pass a budget led to a partial government shutdown in the fall of that year.
Republicans' Yearly Average Congressional Approval Highest Since 2006
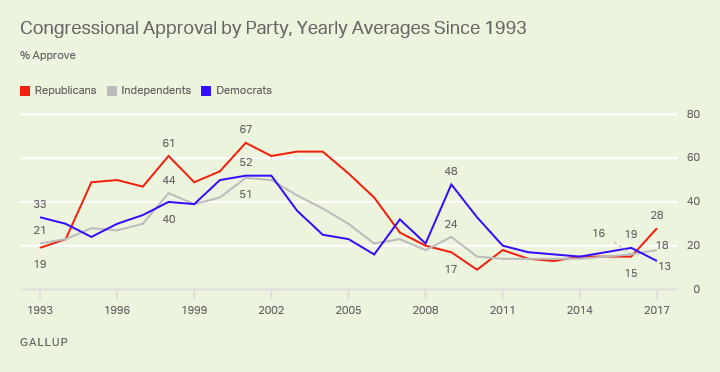
The 2017 congressional approval average among Republicans is 28%, the highest since 2006 when Republicans controlled both houses of Congress and George W. Bush was president. While markedly improved from recent years, the current reading among Republicans is well below the 42% recorded at that point.
Across the aisle, the yearly average among Democrats, 13%, is the lowest recorded by Gallup among Democrats in the last 25 years. Eighteen percent of independents approve.
Typically, those identifying with the party controlling both houses of Congress have been more approving than those identifying with the other party. Looking back at recent history, from 1995 through 2006, when Republicans controlled the House and controlled the Senate for all but a relatively short time in 2001-2002, more Republicans than Democrats approved. Then, in 2009 and 2010, with Democrats in control of both houses of Congress and the presidency, approval by Democrats rose sharply as Republican approval dropped. One notable exception to this pattern occurred in 2015 and 2016 when Republicans controlled both houses of Congress, but there was no difference in the views of Republicans and Democrats.
Bottom Line
Historically, Americans' ratings of Congress have been relatively low, but for most of the past decade, their opinions of their elected representatives in Congress have stagnated at an even lower level. Overall congressional approval was slightly improved this year after Republicans regained control of the executive branch and kept control of the legislative branch. This increase was driven by a rebound in Republicans' ratings, but not to the high levels seen in the past during one-party control. Congress's inability to repeal and replace the Affordable Care Act undoubtedly tempered Republican approval ratings that were much higher right after Trump took office.
Next November, all 435 House seats and 33 Senate seats are up for election. Barring a drastic change in Americans' sentiments, those running for office will be facing voters who hold Congress in extremely low esteem. While history has shown that many voters may view their own representative more positively than they do the institution as a whole, the president's approval rating is typically a key factor in midterm elections. Several recent elections have shown that Trump's approval rating could play a large role for Republicans in 2018.
Survey Methods
Results for this Gallup poll are based on telephone interviews conducted Dec. 4-11, 2017, with a random sample of 1,049 adults, aged 18 and older, living in all 50 U.S. states and the District of Columbia. For results based on the total sample of national adults, the margin of sampling error is ±4 percentage points at the 95% confidence level. All reported margins of sampling error include computed design effects for weighting.
Each sample of national adults includes a minimum quota of 70% cellphone respondents and 30% landline respondents, with additional minimum quotas by time zone within region. Landline and cellular telephone numbers are selected using random-digit-dial methods.
View survey methodology, complete question responses and trends.
Learn more about how the Gallup Poll Social Series works.