Story Highlights
- Majority of Americans have viewed Trump unfavorably throughout his presidency
- Just over a third (36%) view independent counsel Robert Mueller favorably
- Trump is disliked more than predecessors were early in their presidencies
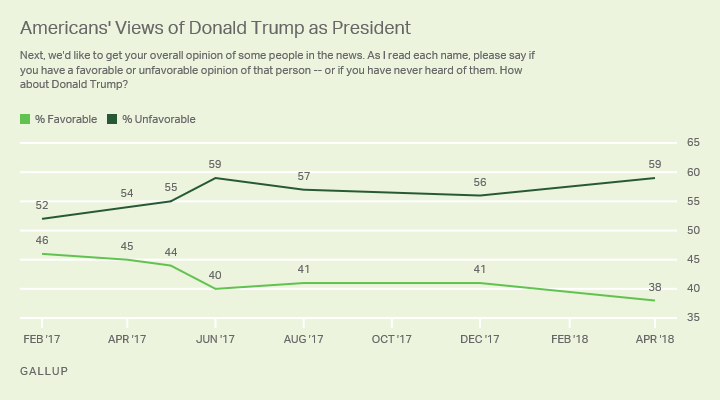
WASHINGTON, D.C. -- President Donald Trump's favorable rating, already low by historical standards, has dropped to 38% -- while his unfavorable rating is at 59%.
This marks a dip in his favorable rating from 41% in December last year. It comes as Trump has escalated his attacks on special counsel Robert Mueller's investigation of possible collusion between the Trump campaign and Russia to influence the 2016 election. In contrast to Trump's overall image, Mueller's image is net positive -- 36% favorable and 28% unfavorable.
| Favorable | Unfavorable | No opinion | Net favorable | ||||||||||||||||||||||||||||||||||||||||||||||||||||||||||||||||||||||||||||||||||||||||||||||||
|---|---|---|---|---|---|---|---|---|---|---|---|---|---|---|---|---|---|---|---|---|---|---|---|---|---|---|---|---|---|---|---|---|---|---|---|---|---|---|---|---|---|---|---|---|---|---|---|---|---|---|---|---|---|---|---|---|---|---|---|---|---|---|---|---|---|---|---|---|---|---|---|---|---|---|---|---|---|---|---|---|---|---|---|---|---|---|---|---|---|---|---|---|---|---|---|---|---|---|---|
| % | % | % | pct. pts. | ||||||||||||||||||||||||||||||||||||||||||||||||||||||||||||||||||||||||||||||||||||||||||||||||
| Trump | 38 | 59 | 3 | -21 | |||||||||||||||||||||||||||||||||||||||||||||||||||||||||||||||||||||||||||||||||||||||||||||||
| Mueller | 36 | 28 | 36 | +8 | |||||||||||||||||||||||||||||||||||||||||||||||||||||||||||||||||||||||||||||||||||||||||||||||
| Gallup, April 2-11, 2018 | |||||||||||||||||||||||||||||||||||||||||||||||||||||||||||||||||||||||||||||||||||||||||||||||||||
More than a third (36%) of the public has no opinion about Mueller, split between those who know of him but have no opinion (15%) and those who have not heard of him (21%).
Among those who have an opinion on both men, 45% view Mueller favorably and Trump unfavorably. Twenty-six percent have a favorable view of Trump and an unfavorable one of Mueller, and 29% like both (12%) or dislike both (17%).
Trump has been a longtime critic of Mueller's investigation, labeling it "a witch hunt" last month. He ramped up his attacks this week after an FBI raid Monday on the offices of his longtime personal attorney Michael Cohen. Trump described the raid as "a disgraceful situation" and mused publicly about firing Mueller.
The raid took place after about three-fourths of the poll had been conducted. There was no significant difference between the favorable ratings before and those after the raid for Trump or Mueller.
Trump's Favorable Ratings Comparatively Low Since He Took Office
Trump's favorable ratings have varied little since he took office at the start of last year, ranging from 46% in February last year to 38% now. In every poll, a majority has had an unfavorable opinion of Trump.

None of his three White House predecessors had a majority of Americans view them unfavorably during their first 15 months in office. (Gallup did not ask the favorability question regularly about presidents before Bill Clinton's first term.)
| Highest favorable | Highest unfavorable | ||||||||||||||||||||||||||||||||||||||||||||||||||||||||||||||||||||||||||||||||||||||||||||||||||
|---|---|---|---|---|---|---|---|---|---|---|---|---|---|---|---|---|---|---|---|---|---|---|---|---|---|---|---|---|---|---|---|---|---|---|---|---|---|---|---|---|---|---|---|---|---|---|---|---|---|---|---|---|---|---|---|---|---|---|---|---|---|---|---|---|---|---|---|---|---|---|---|---|---|---|---|---|---|---|---|---|---|---|---|---|---|---|---|---|---|---|---|---|---|---|---|---|---|---|---|
| % | % | ||||||||||||||||||||||||||||||||||||||||||||||||||||||||||||||||||||||||||||||||||||||||||||||||||
| Donald Trump | 46 | 59 | |||||||||||||||||||||||||||||||||||||||||||||||||||||||||||||||||||||||||||||||||||||||||||||||||
| Barack Obama | 69 | 48 | |||||||||||||||||||||||||||||||||||||||||||||||||||||||||||||||||||||||||||||||||||||||||||||||||
| George W. Bush | 87 | 36 | |||||||||||||||||||||||||||||||||||||||||||||||||||||||||||||||||||||||||||||||||||||||||||||||||
| Bill Clinton | 65 | 45 | |||||||||||||||||||||||||||||||||||||||||||||||||||||||||||||||||||||||||||||||||||||||||||||||||
| Gallup | |||||||||||||||||||||||||||||||||||||||||||||||||||||||||||||||||||||||||||||||||||||||||||||||||||
Public reaction to Trump when he took office was far more negative than the reception other recent presidents have received. His 40% job approval rating after his first month as president was 21 percentage points below the historical average for presidents during the parallel time period. His first favorable rating as president (46%) was significantly lower than the first ratings for Obama (69%), Bush (64%) or Clinton (65%).
The favorability ratings for Obama and Clinton fell by the end of their first 15 months in office -- Clinton's to 56% and Obama's to 52% -- but both still had a majority viewing them favorably. Bush's rating rose to 79% in the spring of his second year in office, as the country rallied behind him in the aftermath of the 9/11 terrorist attacks.
Trump's favorable rating remains higher now than it was during the year before he was elected, when the public's positive views never rose above 35%. In November 2016, immediately after his election, the rating rose to 42% and had stayed at 40% or above until now.
Bottom Line
In spite of the controversy that has swirled around the Trump presidency from its beginning, public opinion about Trump has changed little. The percentage of Americans who like him and the percentage who dislike him have stayed in a fairly narrow range. That is still true, even with the latest slight drop in his favorable rating -- the highest and lowest ratings of his presidency are still less than 10 percentage points apart.
It is too soon to tell whether the latest events surrounding the Mueller investigation will push Trump's image down to pre-election levels, but the reaction from the Americans polled in the immediate aftermath does not indicate a major shift in views.
Survey Methods
Results for this Gallup poll are based on telephone interviews conducted April 2-11, 2018, with a random sample of 1,015 adults, aged 18 and older, living in all 50 U.S. states and the District of Columbia. For results based on the total sample of national adults, the margin of sampling error is ±4 percentage points at the 95% confidence level. All reported margins of sampling error include computed design effects for weighting.
Each sample of national adults includes a minimum quota of 70% cellphone respondents and 30% landline respondents, with additional minimum quotas by time zone within region. Landline and cellular telephone numbers are selected using random-digit-dial methods.
View survey methodology, complete question responses and trends.
Learn more about how the Gallup Poll Social Series works.


