Story Highlights
- Rise in LGBT identification mostly among millennials
- LGBT identification is lower among older generations
- 5.1% of women identify as LGBT, compared with 3.9% of men
WASHINGTON, D.C. -- The percentage of American adults identifying as lesbian, gay, bisexual or transgender (LGBT) increased to 4.5% in 2017, up from 4.1% in 2016 and 3.5% in 2012 when Gallup began tracking the measure. The latest estimate is based on over 340,000 interviews conducted as part of Gallup's daily tracking in 2017.
| 2012 | 2013 | 2014 | 2015 | 2016 | 2017 | ||||||||||||||||||||||||||||||||||||||||||||||||||||||||||||||||||||||||||||||||||||||||||||||
|---|---|---|---|---|---|---|---|---|---|---|---|---|---|---|---|---|---|---|---|---|---|---|---|---|---|---|---|---|---|---|---|---|---|---|---|---|---|---|---|---|---|---|---|---|---|---|---|---|---|---|---|---|---|---|---|---|---|---|---|---|---|---|---|---|---|---|---|---|---|---|---|---|---|---|---|---|---|---|---|---|---|---|---|---|---|---|---|---|---|---|---|---|---|---|---|---|---|---|---|
| % | % | % | % | % | % | ||||||||||||||||||||||||||||||||||||||||||||||||||||||||||||||||||||||||||||||||||||||||||||||
| % LGBT | 3.5 | 3.6 | 3.7 | 3.9 | 4.1 | 4.5 | |||||||||||||||||||||||||||||||||||||||||||||||||||||||||||||||||||||||||||||||||||||||||||||
| Gallup Daily Tracking | |||||||||||||||||||||||||||||||||||||||||||||||||||||||||||||||||||||||||||||||||||||||||||||||||||
Gallup's LGBT estimates are based on those respondents who say "yes" when asked, "Do you, personally, identify as lesbian, gay, bisexual or transgender?" Extrapolation to the latest census estimate of adults 18 and older in the U.S. suggests that more than 11 million adults identify as LGBT in the country today.
The expansion in the number of Americans who identify as LGBT is driven primarily by the cohort of millennials, defined as those born between 1980 and 1999. The percentage of millennials who identify as LGBT expanded from 7.3% to 8.1% from 2016 to 2017, and is up from 5.8% in 2012. By contrast, the LGBT percentage in Generation X (those born from 1965 to 1979) was up only .2% from 2016 to 2017. There was no change last year in LGBT percentage among baby boomers (born 1946 through 1964) and traditionalists (born prior to 1946).
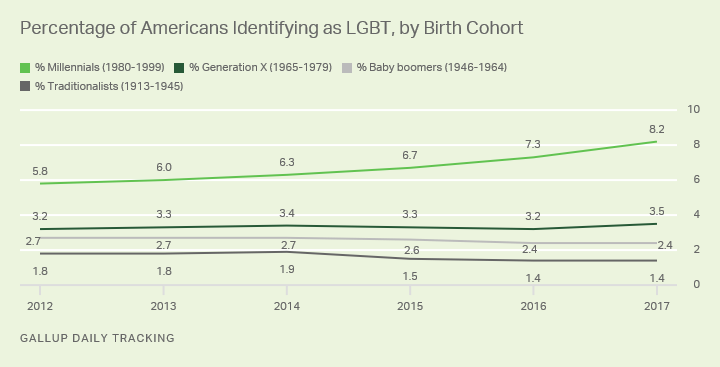
LGBT identification is lower as age increases, although there is a particularly large jump between millennials and those in the next oldest generation, defined as Generation X.
The roughly one-percentage-point increase (0.8 points) in LGBT identification among millennials from 2016 to 2017 is the biggest year-to-year increase among any age group since tracking began in 2012. In contrast, the percentage of traditionalists and baby boomers who identify as LGBT has declined slightly since 2012, while the LGBT percentage among Generation X is up slightly.
Gender Gap in LGBT Identification Expands
Women continue to be more likely to identify as LGBT than men, and this gender gap expanded last year.
Overall, 5.1% of women in 2017 identified as LGBT, compared with 3.9% of men. The change among men over time has been minimal, with the LGBT percentage edging up from 3.4% in 2012 to 3.7% both last year and this year. On the other hand, the percentage of women identifying as LGBT has risen from 3.5% in 2012 to 5.1% today, with the largest jump occurring between 2016 and 2017.
| 2012 | 2013 | 2014 | 2015 | 2016 | 2017 | |||||||||||||||||||||||||||||||||||||||||||||||||||||||||||||||||||||||||||||||||||||||||||||||
|---|---|---|---|---|---|---|---|---|---|---|---|---|---|---|---|---|---|---|---|---|---|---|---|---|---|---|---|---|---|---|---|---|---|---|---|---|---|---|---|---|---|---|---|---|---|---|---|---|---|---|---|---|---|---|---|---|---|---|---|---|---|---|---|---|---|---|---|---|---|---|---|---|---|---|---|---|---|---|---|---|---|---|---|---|---|---|---|---|---|---|---|---|---|---|---|---|---|---|---|---|
| % | % | % | % | % | % | |||||||||||||||||||||||||||||||||||||||||||||||||||||||||||||||||||||||||||||||||||||||||||||||
| Gender | ||||||||||||||||||||||||||||||||||||||||||||||||||||||||||||||||||||||||||||||||||||||||||||||||||||
| Male | 3.4 | 3.5 | 3.6 | 3.7 | 3.7 | 3.9 | ||||||||||||||||||||||||||||||||||||||||||||||||||||||||||||||||||||||||||||||||||||||||||||||
| Female | 3.5 | 3.6 | 3.9 | 4.1 | 4.4 | 5.1 | ||||||||||||||||||||||||||||||||||||||||||||||||||||||||||||||||||||||||||||||||||||||||||||||
| Race/Ethnicity | ||||||||||||||||||||||||||||||||||||||||||||||||||||||||||||||||||||||||||||||||||||||||||||||||||||
| White, non-Hispanic | 3.2 | 3.3 | 3.4 | 3.5 | 3.6 | 4.0 | ||||||||||||||||||||||||||||||||||||||||||||||||||||||||||||||||||||||||||||||||||||||||||||||
| Black, non-Hispanic | 4.4 | 4.0 | 4.6 | 4.5 | 4.6 | 5.0 | ||||||||||||||||||||||||||||||||||||||||||||||||||||||||||||||||||||||||||||||||||||||||||||||
| Hispanic | 4.3 | 4.7 | 4.9 | 5.1 | 5.4 | 6.1 | ||||||||||||||||||||||||||||||||||||||||||||||||||||||||||||||||||||||||||||||||||||||||||||||
| Asian, non-Hispanic | 3.5 | 3.3 | 4.2 | 4.9 | 4.9 | 4.9 | ||||||||||||||||||||||||||||||||||||||||||||||||||||||||||||||||||||||||||||||||||||||||||||||
| Gallup Daily Tracking | ||||||||||||||||||||||||||||||||||||||||||||||||||||||||||||||||||||||||||||||||||||||||||||||||||||
The LGBT percentage has risen among all race and ethnic groups since 2012, although not on an equal basis. Hispanics and Asians have seen the greatest increase, thus contributing the most on a relative basis to the uptick in LGBT identification nationwide. Whites and blacks have seen the least change.
The relative rank order of the LGBT percentages among these four race and ethnic groups has remained roughly the same over the last several years. At 6.1%, Hispanics continue to be the single race or ethnic group most likely to identify as LGBT, while the 4.0 % of whites who identify as LGBT remains the lowest. LGBT identification among blacks and Asians, 4.9% and 5.0%, respectively, is essentially midway between the estimates for Hispanics and whites.
LBGT Identification Highest Among Lower Income Groups
LGBT identification is more common among those with lower incomes, as has been the case consistently since 2012. The income gap is larger this year than it has been, with 6.2% of those making less than $36,000 a year in household income identifying as LGBT, compared with 3.9% of those making $90,000 or more. There are no major differences in LGBT identification by educational attainment, although the percentage of postgraduates who self-reported as LGBT is slightly lower than those with less formal education.
| 2012 | 2013 | 2014 | 2015 | 2016 | 2017 | ||||||||||||||||||||||||||||||||||||||||||||||||||||||||||||||||||||||||||||||||||||||||||||||
|---|---|---|---|---|---|---|---|---|---|---|---|---|---|---|---|---|---|---|---|---|---|---|---|---|---|---|---|---|---|---|---|---|---|---|---|---|---|---|---|---|---|---|---|---|---|---|---|---|---|---|---|---|---|---|---|---|---|---|---|---|---|---|---|---|---|---|---|---|---|---|---|---|---|---|---|---|---|---|---|---|---|---|---|---|---|---|---|---|---|---|---|---|---|---|---|---|---|---|---|
| % | % | % | % | % | % | ||||||||||||||||||||||||||||||||||||||||||||||||||||||||||||||||||||||||||||||||||||||||||||||
| Less than $36,000 | 4.7 | 4.5 | 4.9 | 5.1 | 5.5 | 6.2 | |||||||||||||||||||||||||||||||||||||||||||||||||||||||||||||||||||||||||||||||||||||||||||||
| $36,000 to <$90,000 | 3.1 | 3.4 | 3.5 | 3.9 | 4.0 | 4.7 | |||||||||||||||||||||||||||||||||||||||||||||||||||||||||||||||||||||||||||||||||||||||||||||
| $90,000 or more | 3.0 | 3.5 | 3.6 | 3.6 | 3.7 | 3.9 | |||||||||||||||||||||||||||||||||||||||||||||||||||||||||||||||||||||||||||||||||||||||||||||
| High school or less | 3.5 | 3.5 | 3.9 | 4.1 | 4.1 | 4.5 | |||||||||||||||||||||||||||||||||||||||||||||||||||||||||||||||||||||||||||||||||||||||||||||
| Some college | 3.8 | 3.9 | 3.9 | 3.9 | 4.1 | 4.7 | |||||||||||||||||||||||||||||||||||||||||||||||||||||||||||||||||||||||||||||||||||||||||||||
| College graduate | 2.9 | 3.3 | 3.5 | 3.6 | 4.1 | 4.4 | |||||||||||||||||||||||||||||||||||||||||||||||||||||||||||||||||||||||||||||||||||||||||||||
| Postgraduate | 3.3 | 3.6 | 3.7 | 3.9 | 3.9 | 4.3 | |||||||||||||||||||||||||||||||||||||||||||||||||||||||||||||||||||||||||||||||||||||||||||||
| Gallup Daily Tracking | |||||||||||||||||||||||||||||||||||||||||||||||||||||||||||||||||||||||||||||||||||||||||||||||||||
Bottom Line
This 2017 update on LGBT identification underscores two significant conclusions. First, the percentage of adults in the U.S. who identify as LGBT has been increasing and is now at its highest point across the six years of Gallup's tracking of this measure. Second, the increase has been driven almost totally by millennials, whose self-reports of being LGBT have risen from 5.2% six years ago to 8.1% today. Baby boomers and traditionalists have actually become slightly less likely to identify as LGBT since 2012, while the LGBT percentage among Gen Xers has risen only marginally.
As LGBT demographic expert Dr. Gary Gates noted in his report on Gallup data last year: "A variety of factors can affect the willingness of adults to identify as LGBT. These can include how comfortable and confident survey respondents feel about the confidentiality and privacy of data collected." Thus, it is possible that those in the younger generation who are LGBT are feeling increasingly comfortable over time with their sexual orientation, and thus are more likely to identify as such. Self-reported LGBT identification among older Americans is much more stable.
Self-identification as LGBT is only one of a number of ways of measuring sexual and gender orientation. The general grouping of these four orientations (lesbian, gay, bisexual and transgender) into one question involves significant simplification, and other measurement techniques which ask about each of these categories individually yield different estimates. Additionally, self-identification of sexual orientation can be distinct from other measures which tap into sexual behavior or attraction.
The value of the Gallup data is the use of a constant question wording over time and the largest yearly sample sizes of any effort to measure sexual and gender orientation in the U.S. (the Census does not regularly include such questions in its population updates). Therefore, the upward trajectory in these estimates of the LGBT adult population provides an important social indicator relating to this key aspect of contemporary American society.
Survey Methods
These 2017 results are based on telephone interviews with a random sample of 340,604 U.S. adults, aged 18 and older, living in all 50 states and the District of Columbia, collected from Jan. 2 to Dec. 30, 2017, as part of the Gallup Daily tracking survey and the Gallup-Sharecare Well-Being Index survey. Estimates for years 2013-2016 are based on similar sample sizes, with the estimate for 2012 about half as large. The margin of error for each year of data collection is ±0.1 percentage points at the 95% confidence level. Margins of error for population subgroups are larger depending on sample size. All reported margins of sampling error include computed design effects for weighting.
The 2017 sample of national adults includes a minimum quota of 70% cellphone respondents and 30% landline respondents, with additional minimum quotas by time zone within region. Landline and cellular telephone numbers are selected using random-digit-dial methods.
Learn more about how Gallup Daily tracking works.