Story Highlights
- Conservatives continue to outnumber liberals, 35% to 26%
- Nine-point difference ties last year for slimmest in Gallup trends
- For first time, majority of Democrats identify as liberal
WASHINGTON, D.C. -- Americans' assessment of their political ideology was unchanged in 2018 compared with the year prior when 35% on average described themselves as conservative, 35% as moderate and 26% as liberal. Although conservatives continue to outnumber liberals, the gap in conservatives' favor has narrowed from 19 percentage points in Gallup's 1992 baseline measurement to nine points each of the past two years.
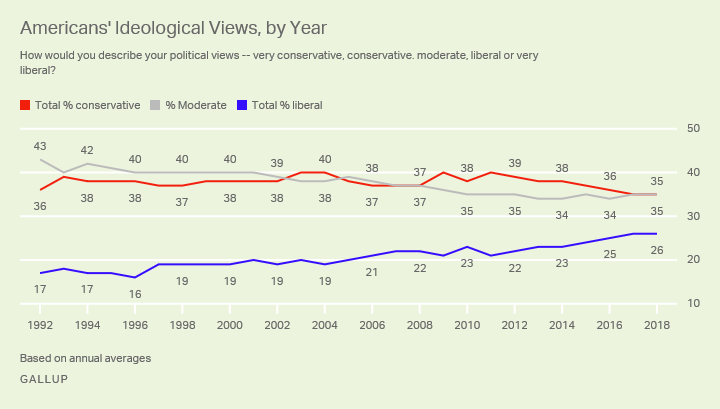
Since 1992, the percentage of Americans identifying as liberal has risen from 17% then to 26% today. This has been mostly offset by a shrinking percentage of moderates, from 43% to 35%. Meanwhile, from 1993 to 2016 the percentage conservative was consistently between 36% and 40%, before dipping to 35% in 2017 and holding at that level in 2018.
These ideology figures are based on combined data from Gallup's monthly GPSS and other standalone surveys conducted each year. The 2018 aggregate includes 13 surveys totaling more than 13,000 national adults.
Majority of Democrats Identify as Liberal for First Time
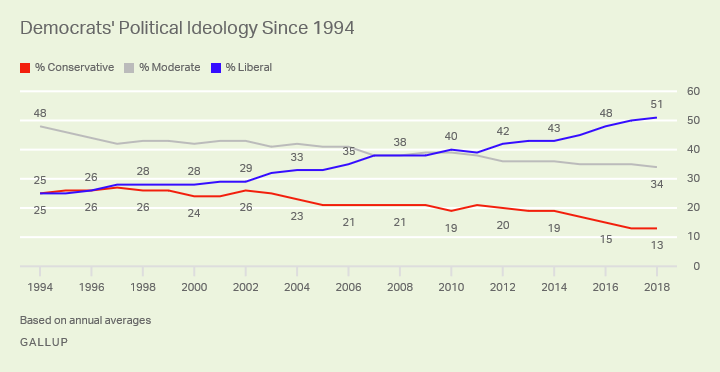
The percentage of Democrats identifying as liberal averaged 51% in 2018, up from 50% in 2017, marking the first time a majority of Democrats have adopted this term, following gradual increases since the 1990s.
In 1994, nearly half of Democrats described their views as moderate while equal percentages, at 25%, identified themselves as liberal and conservative. That fundamental pattern held until about 2002, during the first half of President George W. Bush's first term in office. From 2002 through 2014 -- spanning the Iraq War under Bush and the Barack Obama presidency -- the liberal share increased approximately one percentage point a year, while the percentages moderate and conservative fell. Since 2014, the percentage of Democrats identifying as liberal has increased at an even faster rate of two points per year on average.
Republicans Remain a Majority Conservative Party
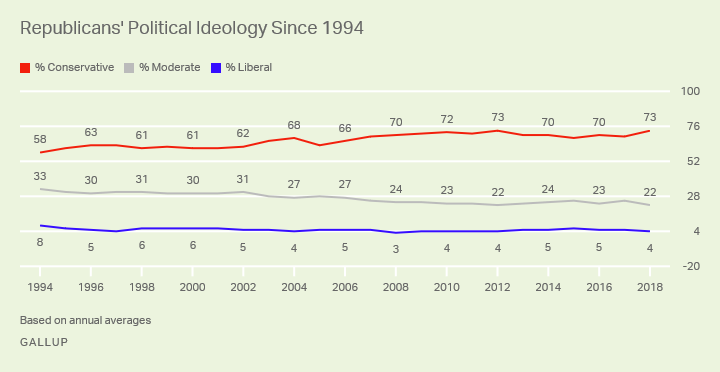
The majority of Republicans has called themselves conservative each year, with most of the rest identifying as moderate. No more than 8% have called themselves liberal on average in any year since 1994.
The percentage of Republicans calling themselves conservative has increased, rising 15 points since 1994. This occurred in two phases:
- After averaging 61% from 1994 to 2002, the percentage of Republicans identifying as conservative jumped to 66% in 2003 and stayed near that level through 2007.
- In 2008, a presidential election year that culminated in the race between Obama and John McCain, the percentage of Republicans identifying as conservative rose to 70% and has since ranged from 68% to 73%.
The 73% of Republicans identifying as conservative in 2018 matches the high point in the trend, previously recorded in 2012.
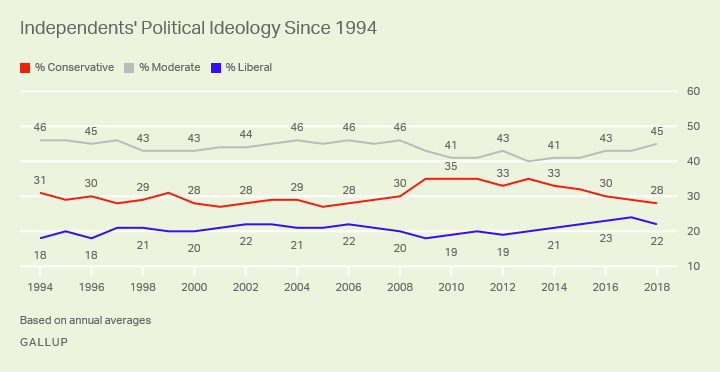
Independents Largely Split, With Moderates Most Dominant
True to their non-partisan stance, the plurality of independents has consistently described their overall political views as moderate. The remainder have been more likely to identify as conservative than liberal, although conservatives' edge with this group has been shrinking in recent years and is now just six points -- it was 17 points at its widest in 2009.
Party, Age, Gender and Education Yield Stark Ideological Differences
Among all major demographic and political categories of Americans, partisan affiliation is by far the strongest correlate with political ideology. The gap between conservatives and liberals is widest among Republicans, with a 69-point gap in favor of conservatives. This is followed by a 38-point gap in favor of liberals among Democrats.
Other societal groups with strong conservative leanings include seniors and adults aged 50 to 64, men, residents of the South and adults with no college education. All of these groups lean conservative by more than 15 percentage points; whites, adults with some college education (but no degree) and residents of the Midwest lean conservative by at least 10 points.
Aside from Democrats, only two groups show strong liberal tendencies: adults with postgraduate education (15 points more liberal than conservative) and blacks (nine points more liberal). However, given the relatively low rate of liberalism nationally, it is notable that adults aged 18 to 29, 30 to 49 lean more liberal than conservative by four points, and adults aged 30 to 49, women, and residents of the East lean marginally more liberal.
Political ideology varies little by household income, with all three major income groups expressing views near the national average.
| Conservative | Moderate | Liberal | Net conservative | ||||||||||||||||||||||||||||||||||||||||||||||||||||||||||||||||||||||||||||||||||||||||||||||||
|---|---|---|---|---|---|---|---|---|---|---|---|---|---|---|---|---|---|---|---|---|---|---|---|---|---|---|---|---|---|---|---|---|---|---|---|---|---|---|---|---|---|---|---|---|---|---|---|---|---|---|---|---|---|---|---|---|---|---|---|---|---|---|---|---|---|---|---|---|---|---|---|---|---|---|---|---|---|---|---|---|---|---|---|---|---|---|---|---|---|---|---|---|---|---|---|---|---|---|---|
| % | % | % | |||||||||||||||||||||||||||||||||||||||||||||||||||||||||||||||||||||||||||||||||||||||||||||||||
| Republicans | 73 | 22 | 4 | +69 | |||||||||||||||||||||||||||||||||||||||||||||||||||||||||||||||||||||||||||||||||||||||||||||||
| 65 and older | 43 | 30 | 22 | +21 | |||||||||||||||||||||||||||||||||||||||||||||||||||||||||||||||||||||||||||||||||||||||||||||||
| Men | 40 | 35 | 21 | +19 | |||||||||||||||||||||||||||||||||||||||||||||||||||||||||||||||||||||||||||||||||||||||||||||||
| Age 50 to 64 | 41 | 32 | 23 | +18 | |||||||||||||||||||||||||||||||||||||||||||||||||||||||||||||||||||||||||||||||||||||||||||||||
| South | 39 | 34 | 21 | +18 | |||||||||||||||||||||||||||||||||||||||||||||||||||||||||||||||||||||||||||||||||||||||||||||||
| No college | 38 | 35 | 21 | +17 | |||||||||||||||||||||||||||||||||||||||||||||||||||||||||||||||||||||||||||||||||||||||||||||||
| White (Non-Hispanic) | 39 | 33 | 24 | +15 | |||||||||||||||||||||||||||||||||||||||||||||||||||||||||||||||||||||||||||||||||||||||||||||||
| Some college | 37 | 36 | 24 | +13 | |||||||||||||||||||||||||||||||||||||||||||||||||||||||||||||||||||||||||||||||||||||||||||||||
| Midwest | 36 | 35 | 25 | +11 | |||||||||||||||||||||||||||||||||||||||||||||||||||||||||||||||||||||||||||||||||||||||||||||||
| $30,000 to $74,999 | 36 | 36 | 26 | +10 | |||||||||||||||||||||||||||||||||||||||||||||||||||||||||||||||||||||||||||||||||||||||||||||||
| U.S. ADULTS | 35 | 35 | 26 | +9 | |||||||||||||||||||||||||||||||||||||||||||||||||||||||||||||||||||||||||||||||||||||||||||||||
| $75,000 or more | 35 | 35 | 28 | +7 | |||||||||||||||||||||||||||||||||||||||||||||||||||||||||||||||||||||||||||||||||||||||||||||||
| Less than $30,000 | 32 | 36 | 26 | +6 | |||||||||||||||||||||||||||||||||||||||||||||||||||||||||||||||||||||||||||||||||||||||||||||||
| Independents | 28 | 45 | 22 | +6 | |||||||||||||||||||||||||||||||||||||||||||||||||||||||||||||||||||||||||||||||||||||||||||||||
| West | 31 | 35 | 29 | +2 | |||||||||||||||||||||||||||||||||||||||||||||||||||||||||||||||||||||||||||||||||||||||||||||||
| College graduate only | 33 | 34 | 31 | +2 | |||||||||||||||||||||||||||||||||||||||||||||||||||||||||||||||||||||||||||||||||||||||||||||||
| Hispanic | 29 | 37 | 29 | 0 | |||||||||||||||||||||||||||||||||||||||||||||||||||||||||||||||||||||||||||||||||||||||||||||||
| Women | 30 | 35 | 30 | 0 | |||||||||||||||||||||||||||||||||||||||||||||||||||||||||||||||||||||||||||||||||||||||||||||||
| Age 30 to 49 | 29 | 37 | 30 | -1 | |||||||||||||||||||||||||||||||||||||||||||||||||||||||||||||||||||||||||||||||||||||||||||||||
| East | 30 | 35 | 31 | -1 | |||||||||||||||||||||||||||||||||||||||||||||||||||||||||||||||||||||||||||||||||||||||||||||||
| Age 18 to 29 | 26 | 40 | 30 | -4 | |||||||||||||||||||||||||||||||||||||||||||||||||||||||||||||||||||||||||||||||||||||||||||||||
| Black (Non-Hispanic) | 22 | 41 | 31 | -9 | |||||||||||||||||||||||||||||||||||||||||||||||||||||||||||||||||||||||||||||||||||||||||||||||
| Postgraduate education | 23 | 37 | 38 | -15 | |||||||||||||||||||||||||||||||||||||||||||||||||||||||||||||||||||||||||||||||||||||||||||||||
| Democrats | 13 | 34 | 51 | -38 | |||||||||||||||||||||||||||||||||||||||||||||||||||||||||||||||||||||||||||||||||||||||||||||||
| Net conservative = % conservative minus % liberal. Based on annual averages for 2018. | |||||||||||||||||||||||||||||||||||||||||||||||||||||||||||||||||||||||||||||||||||||||||||||||||||
| Gallup | |||||||||||||||||||||||||||||||||||||||||||||||||||||||||||||||||||||||||||||||||||||||||||||||||||
Bottom Line
2018 was a year of relative stability in the nation's ideological makeup, following a long-term increase in Americans' identification as liberal, and a corresponding decline in their identification as politically moderate. However, given the generational patterns, with young adults tilting liberal and senior citizens skewing conservative, this is more likely to represent a brief pause in the ideological shift underway rather than a steadying. That, of course, assumes today's young adults are still relatively liberal by the time they are seniors, which remains to be seen.
Although there was also little change in 2018 within the Republican and Democratic Parties, the percentage of Democrats identifying as liberal ticked up one point to cross the symbolic 50% line, marking the first time that party has been majority liberal. Republicans have long been majority conservative, and that, too, expanded slightly. Both of these trends may be related to the decline in Americans identifying with the Republican and Democratic Parties over the past decade, and a corresponding increase in those identifying as political independents. As the size of political parties shrinks, the two major parties may be increasingly comprised of the more hard-core adherents of each side's philosophy.
Whatever the reason for its occurrence, the increased polarization of the parties presents a challenge for governing. With a newly divided Congress, the lack of ideological overlap between Republicans and Democrats sets the stage for political impasses and zero-sum gamesmanship, rather than compromises and "win-win" solutions.
Learn more about how the Gallup Poll Social Series works.