Story Highlights
- Beer still tops wine and liquor as drinkers' favorite adult beverage
- Percentage naming liquor rises to 29%, nearly tying wine at 30%
- Percentage who drink at all holding steady at 65%
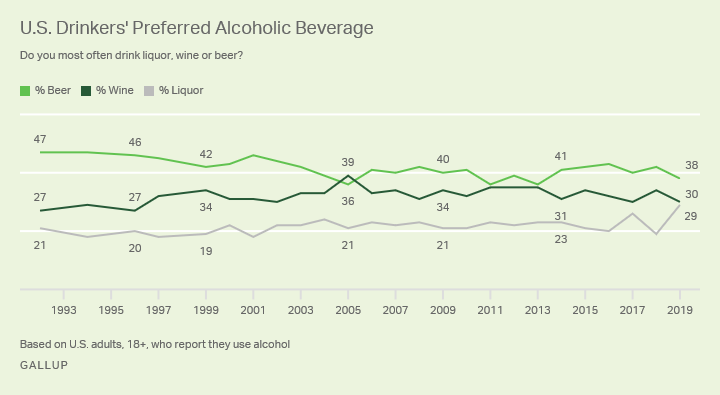
WASHINGTON, D.C. -- Beer continues to be the alcoholic beverage U.S. drinkers say they drink most often; but, for the first time in Gallup trends, liquor essentially ties wine in second place.
The latest results are from Gallup's July 1-12 Consumption Habits survey and are based on telephone interviews with U.S. national adults, aged 18 and older.
Twenty-nine percent of drinkers name liquor as their preferred drink. That is up from 19% a year ago although similar to the 26% who said so in 2017. Despite the lower percentage measured last year, the broad trend is one of increased preference for liquor. The average percentage preferring liquor has risen from 19% in the 1990s to 21% in the early 2000s to 23% over the past five years.
Thirty percent of drinkers now say they most often drink wine. That is on the low end of the range seen over the past two decades, with between 30% and 35% most years saying they prefer wine. However, wine drinking today is still more common than in the 1990s when just over a quarter of U.S. drinkers preferred it.
Preferred Drink Varies by Gender, Age and Region
Drinkers' increased preference for liquor has occurred primarily among young and middle-aged adults, with little movement among those 50 and older. Offsetting this trend, young adults have grown less partial to wine while middle-aged adults are less likely to say they prefer beer.
Still, some enduring patterns continue to hold. The majority of men who drink (55%) say they most often drink beer, while women are more oriented toward wine (45%). A higher percentage of women drinkers this year cite liquor than beer, but this bears watching in subsequent readings to see if the change is meaningful.
Adults under 55 are the age groups most likely to prefer beer as well as liquor, while adults over 55 are the most likely to prefer wine.
Residents of the East and Midwest are most partial to beer. While no particular region is particularly oriented to wine or liquor, the Midwest lags behind the other regions in preferring wine.
There is also a socio-economic component to alcohol preferences, with higher education and high-income Americans being above par in preferring wine. By contrast, lower education and lower-income Americans are the most partial to beer.
| Liquor | Wine | Beer | |||||||||||||||||||||||||||||||||||||||||||||||||||||||||||||||||||||||||||||||||||||||||||||||||
|---|---|---|---|---|---|---|---|---|---|---|---|---|---|---|---|---|---|---|---|---|---|---|---|---|---|---|---|---|---|---|---|---|---|---|---|---|---|---|---|---|---|---|---|---|---|---|---|---|---|---|---|---|---|---|---|---|---|---|---|---|---|---|---|---|---|---|---|---|---|---|---|---|---|---|---|---|---|---|---|---|---|---|---|---|---|---|---|---|---|---|---|---|---|---|---|---|---|---|---|
| % | % | % | |||||||||||||||||||||||||||||||||||||||||||||||||||||||||||||||||||||||||||||||||||||||||||||||||
| Total | 29 | 30 | 38 | ||||||||||||||||||||||||||||||||||||||||||||||||||||||||||||||||||||||||||||||||||||||||||||||||
| Male | 26 | 15 | 55 | ||||||||||||||||||||||||||||||||||||||||||||||||||||||||||||||||||||||||||||||||||||||||||||||||
| Female | 32 | 45 | 21 | ||||||||||||||||||||||||||||||||||||||||||||||||||||||||||||||||||||||||||||||||||||||||||||||||
| Aged 18 to 34 | 39 | 16 | 41 | ||||||||||||||||||||||||||||||||||||||||||||||||||||||||||||||||||||||||||||||||||||||||||||||||
| Aged 35 to 54 | 32 | 24 | 41 | ||||||||||||||||||||||||||||||||||||||||||||||||||||||||||||||||||||||||||||||||||||||||||||||||
| Aged 55 and older | 20 | 44 | 34 | ||||||||||||||||||||||||||||||||||||||||||||||||||||||||||||||||||||||||||||||||||||||||||||||||
| East | 24 | 32 | 40 | ||||||||||||||||||||||||||||||||||||||||||||||||||||||||||||||||||||||||||||||||||||||||||||||||
| Midwest | 27 | 23 | 49 | ||||||||||||||||||||||||||||||||||||||||||||||||||||||||||||||||||||||||||||||||||||||||||||||||
| South | 34 | 30 | 32 | ||||||||||||||||||||||||||||||||||||||||||||||||||||||||||||||||||||||||||||||||||||||||||||||||
| West | 29 | 33 | 36 | ||||||||||||||||||||||||||||||||||||||||||||||||||||||||||||||||||||||||||||||||||||||||||||||||
| White | 29 | 31 | 38 | ||||||||||||||||||||||||||||||||||||||||||||||||||||||||||||||||||||||||||||||||||||||||||||||||
| Non-white | 32 | 27 | 39 | ||||||||||||||||||||||||||||||||||||||||||||||||||||||||||||||||||||||||||||||||||||||||||||||||
| Postgraduate | 22 | 48 | 28 | ||||||||||||||||||||||||||||||||||||||||||||||||||||||||||||||||||||||||||||||||||||||||||||||||
| College graduate only | 25 | 34 | 39 | ||||||||||||||||||||||||||||||||||||||||||||||||||||||||||||||||||||||||||||||||||||||||||||||||
| Some college | 32 | 30 | 34 | ||||||||||||||||||||||||||||||||||||||||||||||||||||||||||||||||||||||||||||||||||||||||||||||||
| No college | 33 | 16 | 47 | ||||||||||||||||||||||||||||||||||||||||||||||||||||||||||||||||||||||||||||||||||||||||||||||||
| $100,000+ household income | 25 | 35 | 36 | ||||||||||||||||||||||||||||||||||||||||||||||||||||||||||||||||||||||||||||||||||||||||||||||||
| $40,000-100,000 | 31 | 27 | 40 | ||||||||||||||||||||||||||||||||||||||||||||||||||||||||||||||||||||||||||||||||||||||||||||||||
| Less than $40,000 | 33 | 23 | 43 | ||||||||||||||||||||||||||||||||||||||||||||||||||||||||||||||||||||||||||||||||||||||||||||||||
| July 1-12, 2019 | |||||||||||||||||||||||||||||||||||||||||||||||||||||||||||||||||||||||||||||||||||||||||||||||||||
| Gallup | |||||||||||||||||||||||||||||||||||||||||||||||||||||||||||||||||||||||||||||||||||||||||||||||||||
Drinking Rate Steady at 65%
Despite slight changes in the type of alcoholic beverages drinkers favor, the proportion of Americans who report drinking alcohol has held steady over the past 20 years at just under two-thirds. Sixty-five percent of all U.S. adults, aged 18 and older, currently say they "have occasion to use alcoholic beverages such as liquor, wine or beer" while 34% describe themselves as a "total abstainer."
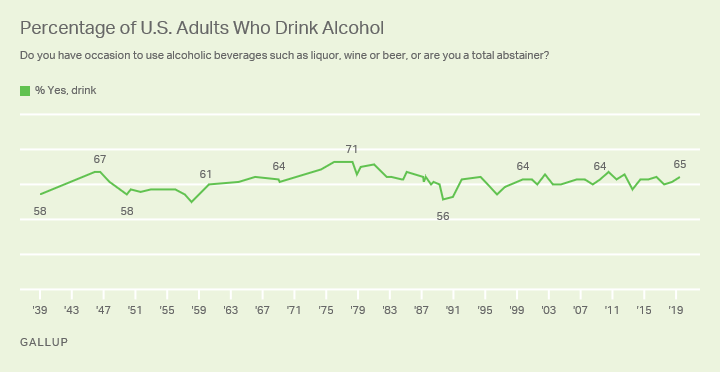
The rate of drinkers is slightly higher among adults of legal drinking age, registering 68% among those 21 and older in the latest survey.
While there are too few adults aged 18 to 20 in a standard survey of 1,000 national adults to provide a reliable estimate of the percentage of drinkers in this age group, the rate is 36% in combined Gallup data from 2010-2019. Consistent with federal statistics showing a decline in teen drinking, that represents a significant decline compared with 2001 to 2009, when 51% of 18 to 20 year-olds reported drinking.
Average Drinks Consumed Weekly Holds Steady at 4.0
Gallup measures the amount that Americans drink by asking those who ever drink how many drinks they had in the past seven days. The average number today is 4.0, similar, to the figure most years since 2011. That includes the 30% of drinkers who say they had no alcoholic drink in the past seven days.
Gallup trends indicate that alcohol consumption is a bit more restrained today than it was from 2002 to 2010 when drinkers recorded consuming an average 4.6 drinks per week. Still, drinking is not as light as the five years earlier, from 1996 to 2001, when the average was 3.4 drinks.
Bottom Line
Alcohol remains a popular beverage in the U.S., with nearly two in three Americans drinking it. However, Americans' preferred type of alcoholic beverage has varied a bit over the years, possibly reflecting such industry trends as the rise of craft beers and more recently craft liquors. Health trends, such as the recent popularity of low carbohydrate diets -- 28% of Americans recently told Gallup they try to avoid carbohydrates -- may also explain why some people have gravitated toward liquor. Unlike wine and beer, straight liquor is carb-free.
While beer is not as dominant as it was a quarter-century ago, it remains the most popular of the three types of alcohol, with men primarily responsible for keeping it in the top spot.
Roughly seven in 10 Americans who use alcohol say their most recent drink was within the past week; 30% say they last drank over a week ago.
View complete question responses and trends.
Learn more about how the Gallup Poll Social Series works.