GALLUP NEWS SERVICE
PRINCETON, NJ -- For the third consecutive time since early August, a Gallup Poll finds Sen. Hillary Clinton leading her closest competitor for the 2008 Democratic presidential nomination, Barack Obama, by more than 20 points among Democrats nationwide. Clinton enjoys sizable leads in all major regions of the country, as well as among men, women, and the subset of Democrats who say they are most likely to vote in the Democratic primary in their state next year.
Clinton is currently favored by 45% of Democrats for the nomination, but her broad favorable ratings underscore the fact that a majority of Democrats would ultimately be willing to support her.
According to the new USA Today/Gallup survey, conducted Sept. 7-8, former Sen. John Edwards continues to rank third in national Democratic preferences. The 16% support he receives from Democrats (including independents who lean Democratic) is within the margin of error of the 12% to 13% support levels he earned in August. But if current preferences for the top three candidates are maintained in a subsequent survey, it would represent a slight improvement in Edwards' standing, putting him within single digits of Obama for second place.
Other Democratic candidates, including Sen. Joe Biden and former New Mexico Gov. Bill Richardson among others, continue to receive nominal support, as they have throughout the campaign.
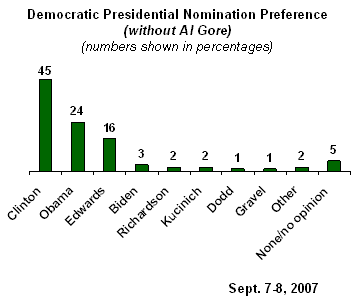
Gore Maintains Tie for Third; Has Little Impact on Race
The above results are all based on the assumption that former Vice President Al Gore will not be a candidate for the nomination. With Gore included in the field, Clinton still enjoys a solid 20-point lead over Obama (39% vs. 19%), while Gore about ties with Edwards for third place. Although Gore has made it increasingly evident that he does not intend to run for the nomination, his current 16% support is no different from the 15% he received in mid-August.
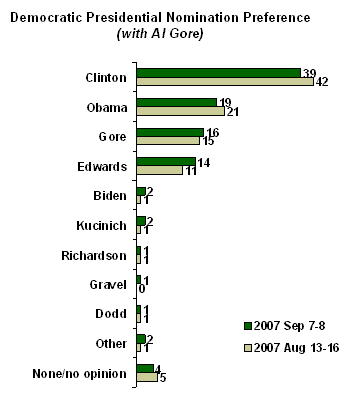
The Race in Detail
According to the latest Gallup survey, Clinton leads Obama for the nomination among Democratic women as well as Democratic men, and in all four major regions of the country.
|
Support for Leading Democrats, by Major Democratic Subgroups, Sept. 7-8, 2007 |
|||
|
Clinton |
Obama |
Clinton lead |
|
|
Gender |
% |
% |
|
|
Men |
41 |
23 |
+18 |
|
Women |
48 |
25 |
+23 |
|
Region |
|||
|
East |
49 |
17 |
+32 |
|
Midwest |
42 |
27 |
+15 |
|
South |
48 |
25 |
+23 |
|
West |
42 |
27 |
+15 |
Gallup's early reading on voter interest in the primary elections suggests Obama does not enjoy some hidden potential of achieving an upset victory by virtue of voter turnout. The percentage of his supporters saying they are extremely likely to participate in their state's primary election or caucus next year is higher than Clinton's (63% vs. 54%), but not by a statistically significant margin. Also, the higher the turnout, the less possibility there appears to be for such an advantage, as a similar percentage of both groups (79% of Clinton supporters and 76% of Obama supporters) say they are either extremely likely or very likely to vote.
|
Likelihood of Voting in Democratic Primary/Caucus, Based on Candidate Favored for the Nomination, Sept. 7-8, 2007 |
|||
|
Clinton |
Obama |
Edwards |
|
|
% |
% |
% |
|
|
Extremely likely |
54 |
63 |
44 |
|
Very likely |
25 |
13 |
33 |
|
Somewhat likely |
9 |
16 |
10 |
|
Not likely |
9 |
6 |
10 |
Clinton's Potential Support Runs Deep
Clinton is proving to be a formidable frontrunner, as not only has she led Obama by a significant margin in all but one Gallup Poll trial heat since February, but she enjoys high favorable ratings in the Democratic Party that extend well beyond her current 45% support level. Three-quarters of Democrats and Democratic leaners have a favorable view of the former first lady, while only 20% have an unfavorable view of her. Obama and Edwards lag behind in favorability because more people are not familiar with them.
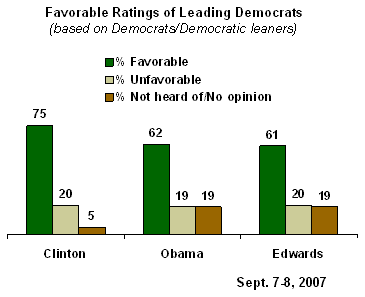
Additionally, at least 63% of Democrats are willing to vote for Clinton in the Democratic primaries next year. That is the percentage naming her as either their first or second choice for the nomination. The total percentage willing to support Obama, Edwards, or Gore is much lower. Even when given two chances to be named as voters' preferred candidates, none of the bottom tier candidates is named by more than 5% of Democrats.
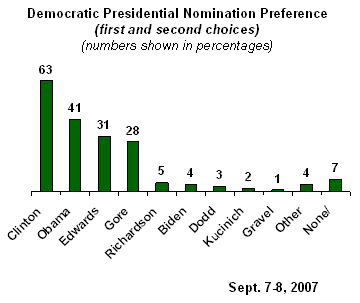
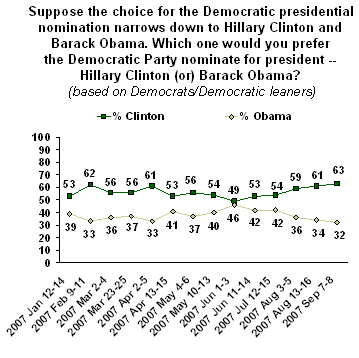
Clinton's 63% potential support is identical to the percentage favoring her for the nomination when given a narrowed-down choice of either her or Obama. This is similar to her showing on this measure in mid-August, and is a slight improvement for her from earlier in the summer.
Survey Methods
Results are based on telephone interviews with 1,028 national adults, aged 18 and older, conducted Sept. 7-8, 2007. For results based on the total sample of national adults, one can say with 95% confidence that the maximum margin of sampling error is ±3 percentage points.
For results based on the sample of 500 Democrats or Democratic leaners, the maximum margin of sampling error is ±5 percentage points.
In addition to sampling error, question wording and practical difficulties in conducting surveys can introduce error or bias into the findings of public opinion polls.
2. Next, we'd like to get your overall opinion of some people in the news. As I read each name, please say if you have a favorable or unfavorable opinion of these people -- or if you have never heard of them. How about -- [ITEMS A-G ROTATED, ITEM H READ LAST]?
A. Hillary Clinton
|
Favor-able |
Unfavor-able |
No opinion |
|
|
2007 |
% |
% |
% |
|
2007 Sep 7-8 |
49 |
46 |
5 |
|
2007 Aug 13-16 |
47 |
48 |
5 |
|
2007 Aug 3-5 |
47 |
49 |
3 |
|
2007 Jul 12-15 |
47 |
48 |
5 |
|
2007 Jul 6-8 |
48 |
48 |
5 |
|
2007 Jun 1-3 |
46 |
50 |
3 |
|
2007 May 10-13 |
53 |
45 |
2 |
|
2007 May 4-6 |
50 |
47 |
3 |
|
2007 Apr 13-15 |
45 |
52 |
4 |
|
2007 Apr 2-5 |
47 |
49 |
4 |
|
2007 Mar 23-25 |
48 |
48 |
3 |
|
2007 Mar 2-4 |
54 |
42 |
3 |
|
2007 Feb 9-11 |
58 |
40 |
1 |
|
2006 |
|||
|
2006 Nov 9-12 |
53 |
42 |
5 |
|
2006 Jul 28-30 |
50 |
44 |
7 |
|
2006 Jun 23-25 |
51 |
44 |
5 |
|
2005 |
|||
|
2005 Oct 21-23 |
54 |
41 |
5 |
|
2005 Jul 25-28 |
53 |
43 |
4 |
|
2005 May 20-22 |
55 |
39 |
6 |
|
2005 Feb 25-27 |
53 |
41 |
6 |
|
2004 |
|||
|
2004 Jul 19-21 ^ |
56 |
38 |
6 |
|
2003 |
|||
|
2003 Oct 24-26 |
51 |
44 |
5 |
|
2003 Sep 19-21 |
54 |
40 |
6 |
|
2003 Jun 27-29 ^ |
52 |
44 |
4 |
|
2003 Jun 9-10 |
53 |
43 |
4 |
|
2003 Mar 14-15 |
45 |
46 |
9 |
|
2002 |
|||
|
2002 Dec 16-17 |
48 |
46 |
6 |
|
2002 Sep 23-26 |
47 |
44 |
9 |
|
2001 |
|||
|
2001 Aug 3-5 |
51 |
44 |
5 |
|
2001 Mar 5-7 |
44 |
53 |
3 |
|
2001 Feb 19-21 |
49 |
44 |
7 |
|
2001 Feb 1-4 |
52 |
43 |
5 |
|
2000 |
|||
|
2000 Nov 13-15 |
56 |
39 |
5 |
|
2000 Oct 25-28 |
52 |
43 |
5 |
|
2000 Aug 4-5 |
45 |
50 |
5 |
|
2000 Feb 4-6 |
55 |
39 |
6 |
E. Barack Obama
|
Favorable |
Unfavorable |
Never heard of |
No opinion |
|
|
% |
% |
% |
% |
|
|
2007 Sep 7-8 |
48 |
32 |
11 |
10 |
|
2007 Aug 13-16 |
52 |
29 |
9 |
10 |
|
2007 Aug 3-5 |
48 |
34 |
9 |
9 |
|
2007 Jul 12-15 |
49 |
26 |
11 |
14 |
|
2007 Jul 6-8 |
53 |
27 |
11 |
10 |
|
2007 Jun 1-3 |
53 |
25 |
10 |
13 |
|
2007 May 10-13 |
55 |
20 |
16 |
9 |
|
2007 May 4-6 |
50 |
24 |
13 |
12 |
|
2007 Apr 13-15 |
52 |
27 |
10 |
10 |
|
2007 Apr 2-5 |
49 |
24 |
14 |
12 |
|
2007 Mar 23-25 |
53 |
24 |
14 |
9 |
|
2007 Mar 2-4 |
58 |
18 |
15 |
9 |
|
2007 Feb 9-11 |
53 |
19 |
16 |
12 |
|
2006 Dec 8-10 ^ |
42 |
11 |
33 |
14 |
|
^ WORDING: Illinois Senator, Barack Obama |
||||
F. John Edwards
|
Favorable |
Unfavorable |
Never heard of |
No opinion |
|
|
% |
% |
% |
% |
|
|
2007 Sep 7-8 |
47 |
32 |
8 |
14 |
|
2007 Aug 13-16 |
47 |
36 |
8 |
9 |
|
2007 Aug 3-5 |
47 |
35 |
9 |
10 |
|
2007 Jul 12-15 |
44 |
33 |
12 |
12 |
|
2007 Jul 6-8 |
50 |
32 |
8 |
9 |
|
2007 Jun 1-3 |
44 |
32 |
9 |
15 |
|
2007 May 10-13 |
56 |
24 |
11 |
9 |
|
2007 May 4-6 |
49 |
31 |
9 |
9 |
|
2007 Apr 13-15 |
52 |
31 |
6 |
11 |
|
2007 Apr 2-5 |
53 |
30 |
9 |
9 |
|
2007 Mar 23-25 |
55 |
25 |
8 |
11 |
|
2007 Mar 2-4 |
51 |
28 |
9 |
12 |
|
2007 Feb 9-11 |
49 |
31 |
12 |
8 |
|
2006 Dec 8-10 † |
54 |
21 |
13 |
12 |
|
2004 Oct 9-10 |
48 |
37 |
6 |
9 |
|
2004 Sep 3-5 |
56 |
30 |
3 |
11 |
|
2004 Aug 23-25 ^ |
52 |
28 |
4 |
16 |
|
2004 Jul 30-Aug 1 |
59 |
27 |
3 |
11 |
|
2004 Jul 19-21 ^ |
52 |
26 |
5 |
17 |
|
2004 Jul 8-11 |
55 |
24 |
6 |
15 |
|
2004 Jan 29-Feb 1 |
54 |
21 |
10 |
15 |
|
2004 Jan 2-5‡ |
24 |
24 |
27 |
25 |
|
2003 Nov 10-12 ‡ |
22 |
18 |
37 |
23 |
|
^ Asked of a half sample |
||||
|
† WORDING: Former North Carolina Senator, John Edwards |
||||
|
‡ WORDING: North Carolina Senator, John Edwards |
||||
12. (Asked of Democrats and independents who lean to the Democratic Party) Suppose the choice for the Democratic presidential nomination narrows down to Hillary Clinton and Barack Obama. Which one would you prefer the Democratic Party nominate for president -- [ROTATED: Hillary Clinton (or) Barack Obama]?
BASED ON 500 DEMOCRATS AND DEMOCRATIC LEANERS
|
Clinton |
Obama |
No opinion |
|
|
% |
% |
% |
|
|
2007 Sep 7-8 |
63 |
32 |
5 |
|
2007 Aug 13-16 |
61 |
34 |
5 |
|
2007 Aug 3-5 |
59 |
36 |
5 |
|
2007 Jul 12-15 |
54 |
42 |
4 |
|
2007 Jun 11-14 |
53 |
42 |
5 |
|
2007 Jun 1-3 |
49 |
46 |
5 |
|
2007 May 10-13 |
54 |
40 |
7 |
|
2007 May 4-6 |
56 |
37 |
7 |
|
2007 Apr 13-15 |
53 |
41 |
6 |
|
2007 Apr 2-5 |
61 |
33 |
6 |
|
2007 Mar 23-25 |
56 |
37 |
6 |
|
2007 Mar 2-4 |
56 |
36 |
8 |
|
2007 Feb 9-11 |
62 |
33 |
5 |
|
2007 Jan 12-14 |
53 |
39 |
8 |
13. (Asked of Democrats and independents who lean to the Democratic Party) How likely are you to vote in the Democratic presidential primary or caucus in your state when it is held next year -- extremely likely, very likely, somewhat likely, or not likely?
BASED ON 500 DEMOCRATS AND DEMOCRATIC LEANERS
|
Extremely likely |
Very
|
Somewhat likely |
Not
|
No opinion |
|
|
% |
% |
% |
% |
% |
|
|
2007 Sep 7-8 |
52 |
25 |
11 |
10 |
2 |
|
2007 Aug 13-16 |
61 |
19 |
12 |
7 |
1 |
|
2007 Aug 3-5 |
58 |
25 |
10 |
7 |
1 |
|
2007 Jul 12-15 |
64 |
19 |
12 |
5 |
1 |
|
2007 Jul 6-8 |
58 |
23 |
8 |
11 |
1 |
|
2007 Jun 11-14 |
60 |
24 |
9 |
7 |
* |
|
* = Less than 0.5% |
|||||
