
Story Highlights
- Biden's favorability is up six points to 55% in postelection reading
- Trump's favorability has edged down three points to 42% over same period
- Democratic Party viewed favorably by 45%; Republican Party, by 43%
WASHINGTON, D.C. -- President-elect Joe Biden's favorability rating has risen six percentage points to 55% since the election compared with his final preelection reading. At the same time, President Donald Trump's favorability has edged down three points to 42%.
Biden's current rating is the highest it has been since February 2019, two months before he declared his candidacy for president, when it was 56%. Trump's latest favorability falls short of the highest of his presidency, 49% in April, during the initial stages of the coronavirus pandemic.

Line graph. Favorable ratings of Donald Trump and Joe Biden since January 2019. The latest readings, from November 2020, are 55% for Biden and 42% for Trump.
These findings are from a postelection survey conducted Nov. 5-19, a period during which Trump's legal team was challenging the results in a number of states. The increase in Biden's favorability between Gallup's final preelection and first postelection readings is driven by independents and Republicans, whose positive ratings of Biden grew from 48% to 55% and 6% to 12%, respectively. Democrats' nearly unanimous positive ratings remained constant.
Trump's slightly lower postelection favorable rating is owed more to Republicans than independents or Democrats. Republicans' rating of the president fell six points to 89%, while it was essentially unchanged among independents and static among Democrats.
| Oct 16-27 | Nov 5-19 | |||||||||||||||||||||||||||||||||||||||||||||||||||||||||||||||||||||||||||||||||||||||||||||||||||
|---|---|---|---|---|---|---|---|---|---|---|---|---|---|---|---|---|---|---|---|---|---|---|---|---|---|---|---|---|---|---|---|---|---|---|---|---|---|---|---|---|---|---|---|---|---|---|---|---|---|---|---|---|---|---|---|---|---|---|---|---|---|---|---|---|---|---|---|---|---|---|---|---|---|---|---|---|---|---|---|---|---|---|---|---|---|---|---|---|---|---|---|---|---|---|---|---|---|---|---|---|
| % | % | |||||||||||||||||||||||||||||||||||||||||||||||||||||||||||||||||||||||||||||||||||||||||||||||||||
| Joe Biden | ||||||||||||||||||||||||||||||||||||||||||||||||||||||||||||||||||||||||||||||||||||||||||||||||||||
| Republicans | 6 | 12 | ||||||||||||||||||||||||||||||||||||||||||||||||||||||||||||||||||||||||||||||||||||||||||||||||||
| Independents | 48 | 55 | ||||||||||||||||||||||||||||||||||||||||||||||||||||||||||||||||||||||||||||||||||||||||||||||||||
| Democrats | 95 | 96 | ||||||||||||||||||||||||||||||||||||||||||||||||||||||||||||||||||||||||||||||||||||||||||||||||||
| Donald Trump | ||||||||||||||||||||||||||||||||||||||||||||||||||||||||||||||||||||||||||||||||||||||||||||||||||||
| Republicans | 95 | 89 | ||||||||||||||||||||||||||||||||||||||||||||||||||||||||||||||||||||||||||||||||||||||||||||||||||
| Independents | 38 | 36 | ||||||||||||||||||||||||||||||||||||||||||||||||||||||||||||||||||||||||||||||||||||||||||||||||||
| Democrats | 3 | 3 | ||||||||||||||||||||||||||||||||||||||||||||||||||||||||||||||||||||||||||||||||||||||||||||||||||
| GALLUP, 2020 | ||||||||||||||||||||||||||||||||||||||||||||||||||||||||||||||||||||||||||||||||||||||||||||||||||||
Historical Comparisons of Candidate Favorability Pre- and Postelection
Since 2000, the winning presidential candidate's favorability ratings have increased slightly after the election. In 2000, when George W. Bush was not declared the winner until several weeks after Election Day, neither he nor Al Gore enjoyed an initial postelection bump. Yet, after the Supreme Court's Dec. 12 decision in Bush v. Gore determined Bush had won reelection, his favorability rose four points.
Additionally, since 2000, the winner's postelection favorability reached the majority level in every election except 2016, when Trump was the most personally unpopular presidential candidate in Gallup polling history. Biden's six-point increase in favorability this year is in line with those for other presidents and presidents-elect.
The pattern for losing presidential candidates is mixed. Some, including John McCain in 2008 and Mitt Romney in 2012, had significantly higher favorable ratings after the election. (McCain's showed the greatest increase: 14 points.) Hillary Clinton's favorability was unchanged after the 2016 election, and there is no reading for John Kerry until July 2005, by which time his favorability had fallen 10 points. Trump's three-point postelection decline is unique over the past six presidential election cycles.
| Final preelection reading | Postelection reading (Nov/Dec) | Change | ||||||||||||||||||||||||||||||||||||||||||||||||||||||||||||||||||||||||||||||||||||||||||||||||||
|---|---|---|---|---|---|---|---|---|---|---|---|---|---|---|---|---|---|---|---|---|---|---|---|---|---|---|---|---|---|---|---|---|---|---|---|---|---|---|---|---|---|---|---|---|---|---|---|---|---|---|---|---|---|---|---|---|---|---|---|---|---|---|---|---|---|---|---|---|---|---|---|---|---|---|---|---|---|---|---|---|---|---|---|---|---|---|---|---|---|---|---|---|---|---|---|---|---|---|---|---|
| % | % | pct. pts. | ||||||||||||||||||||||||||||||||||||||||||||||||||||||||||||||||||||||||||||||||||||||||||||||||||
| 2020 | ||||||||||||||||||||||||||||||||||||||||||||||||||||||||||||||||||||||||||||||||||||||||||||||||||||
| Joe Biden | 49 | 55 | +6 | |||||||||||||||||||||||||||||||||||||||||||||||||||||||||||||||||||||||||||||||||||||||||||||||||
| Donald Trump | 45 | 42 | -3 | |||||||||||||||||||||||||||||||||||||||||||||||||||||||||||||||||||||||||||||||||||||||||||||||||
| 2016 | ||||||||||||||||||||||||||||||||||||||||||||||||||||||||||||||||||||||||||||||||||||||||||||||||||||
| Donald Trump | 34 | 42 | +8 | |||||||||||||||||||||||||||||||||||||||||||||||||||||||||||||||||||||||||||||||||||||||||||||||||
| Hillary Clinton | 43 | 43 | 0 | |||||||||||||||||||||||||||||||||||||||||||||||||||||||||||||||||||||||||||||||||||||||||||||||||
| 2012 | ||||||||||||||||||||||||||||||||||||||||||||||||||||||||||||||||||||||||||||||||||||||||||||||||||||
| Barack Obama | 55 | 58 | +3 | |||||||||||||||||||||||||||||||||||||||||||||||||||||||||||||||||||||||||||||||||||||||||||||||||
| Mitt Romney | 46 | 50 | +4 | |||||||||||||||||||||||||||||||||||||||||||||||||||||||||||||||||||||||||||||||||||||||||||||||||
| 2008 | ||||||||||||||||||||||||||||||||||||||||||||||||||||||||||||||||||||||||||||||||||||||||||||||||||||
| Barack Obama | 62 | 68 | +6 | |||||||||||||||||||||||||||||||||||||||||||||||||||||||||||||||||||||||||||||||||||||||||||||||||
| John McCain | 50 | 64 | +14 | |||||||||||||||||||||||||||||||||||||||||||||||||||||||||||||||||||||||||||||||||||||||||||||||||
| 2004 | ||||||||||||||||||||||||||||||||||||||||||||||||||||||||||||||||||||||||||||||||||||||||||||||||||||
| George W. Bush | 51 | 60 | +9 | |||||||||||||||||||||||||||||||||||||||||||||||||||||||||||||||||||||||||||||||||||||||||||||||||
| John Kerry | 52 | NA | NA | |||||||||||||||||||||||||||||||||||||||||||||||||||||||||||||||||||||||||||||||||||||||||||||||||
| 2000* | ||||||||||||||||||||||||||||||||||||||||||||||||||||||||||||||||||||||||||||||||||||||||||||||||||||
| George W. Bush | 55 | 59 | +4 | |||||||||||||||||||||||||||||||||||||||||||||||||||||||||||||||||||||||||||||||||||||||||||||||||
| Al Gore | 56 | 57 | +1 | |||||||||||||||||||||||||||||||||||||||||||||||||||||||||||||||||||||||||||||||||||||||||||||||||
| * Data for 2000 are among registered voters | ||||||||||||||||||||||||||||||||||||||||||||||||||||||||||||||||||||||||||||||||||||||||||||||||||||
| GALLUP | ||||||||||||||||||||||||||||||||||||||||||||||||||||||||||||||||||||||||||||||||||||||||||||||||||||
Favorable Ratings of Parties Are Similar
Although Americans' views of the Republican and Democratic Parties are not appreciably different from readings over the past several months, the slight edge that the Democratic Party enjoyed over the Republican Party in September has narrowed. The 45% of U.S. adults who view the Democratic Party favorably is not significantly different from the 43% who have the same view of the Republican Party.
The highest recent reading for the Republican Party was 51% in January amid Trump's impeachment trial. The Democratic Party has not reached that level since November 2012, after Barack Obama won a second term.
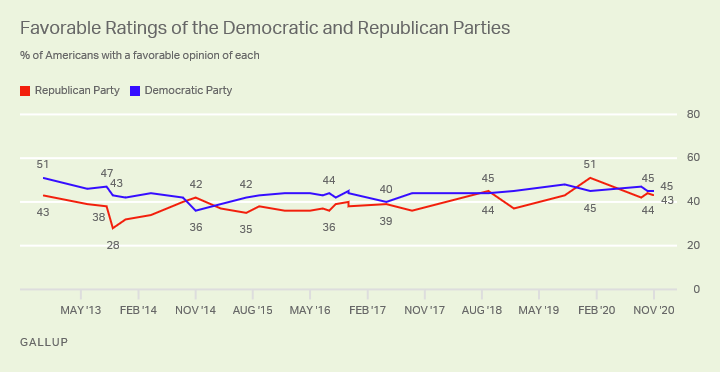
Line graph. Favorable ratings of the Democratic and Republican Parties since 2012. The latest readings, from November 2020, are 45% for the Democratic Party and 43% for the Republican Party.
While roughly nine in 10 Democrats and Republicans alike hold favorable opinions of their own parties, independents view the Democratic Party more positively than the Republican Party, 41% vs. 33%.
| Democratic Party | Republican Party | ||||||||||||||||||||||||||||||||||||||||||||||||||||||||||||||||||||||||||||||||||||||||||||||||||
|---|---|---|---|---|---|---|---|---|---|---|---|---|---|---|---|---|---|---|---|---|---|---|---|---|---|---|---|---|---|---|---|---|---|---|---|---|---|---|---|---|---|---|---|---|---|---|---|---|---|---|---|---|---|---|---|---|---|---|---|---|---|---|---|---|---|---|---|---|---|---|---|---|---|---|---|---|---|---|---|---|---|---|---|---|---|---|---|---|---|---|---|---|---|---|---|---|---|---|---|
| % | % | ||||||||||||||||||||||||||||||||||||||||||||||||||||||||||||||||||||||||||||||||||||||||||||||||||
| Republicans | 5 | 90 | |||||||||||||||||||||||||||||||||||||||||||||||||||||||||||||||||||||||||||||||||||||||||||||||||
| Independents | 41 | 33 | |||||||||||||||||||||||||||||||||||||||||||||||||||||||||||||||||||||||||||||||||||||||||||||||||
| Democrats | 92 | 9 | |||||||||||||||||||||||||||||||||||||||||||||||||||||||||||||||||||||||||||||||||||||||||||||||||
| GALLUP, Nov. 5-19, 2020 | |||||||||||||||||||||||||||||||||||||||||||||||||||||||||||||||||||||||||||||||||||||||||||||||||||
View complete question responses and trends (PDF download).
Learn more about how the Gallup Poll Social Series works.