Story Highlights
- 48% now prefer to live in a town or rural area, up from 39% in 2018
- Preference for cities fairly steady, while desire for suburbs dips
- Preference for country up most among GOP and non-Whites, also in South
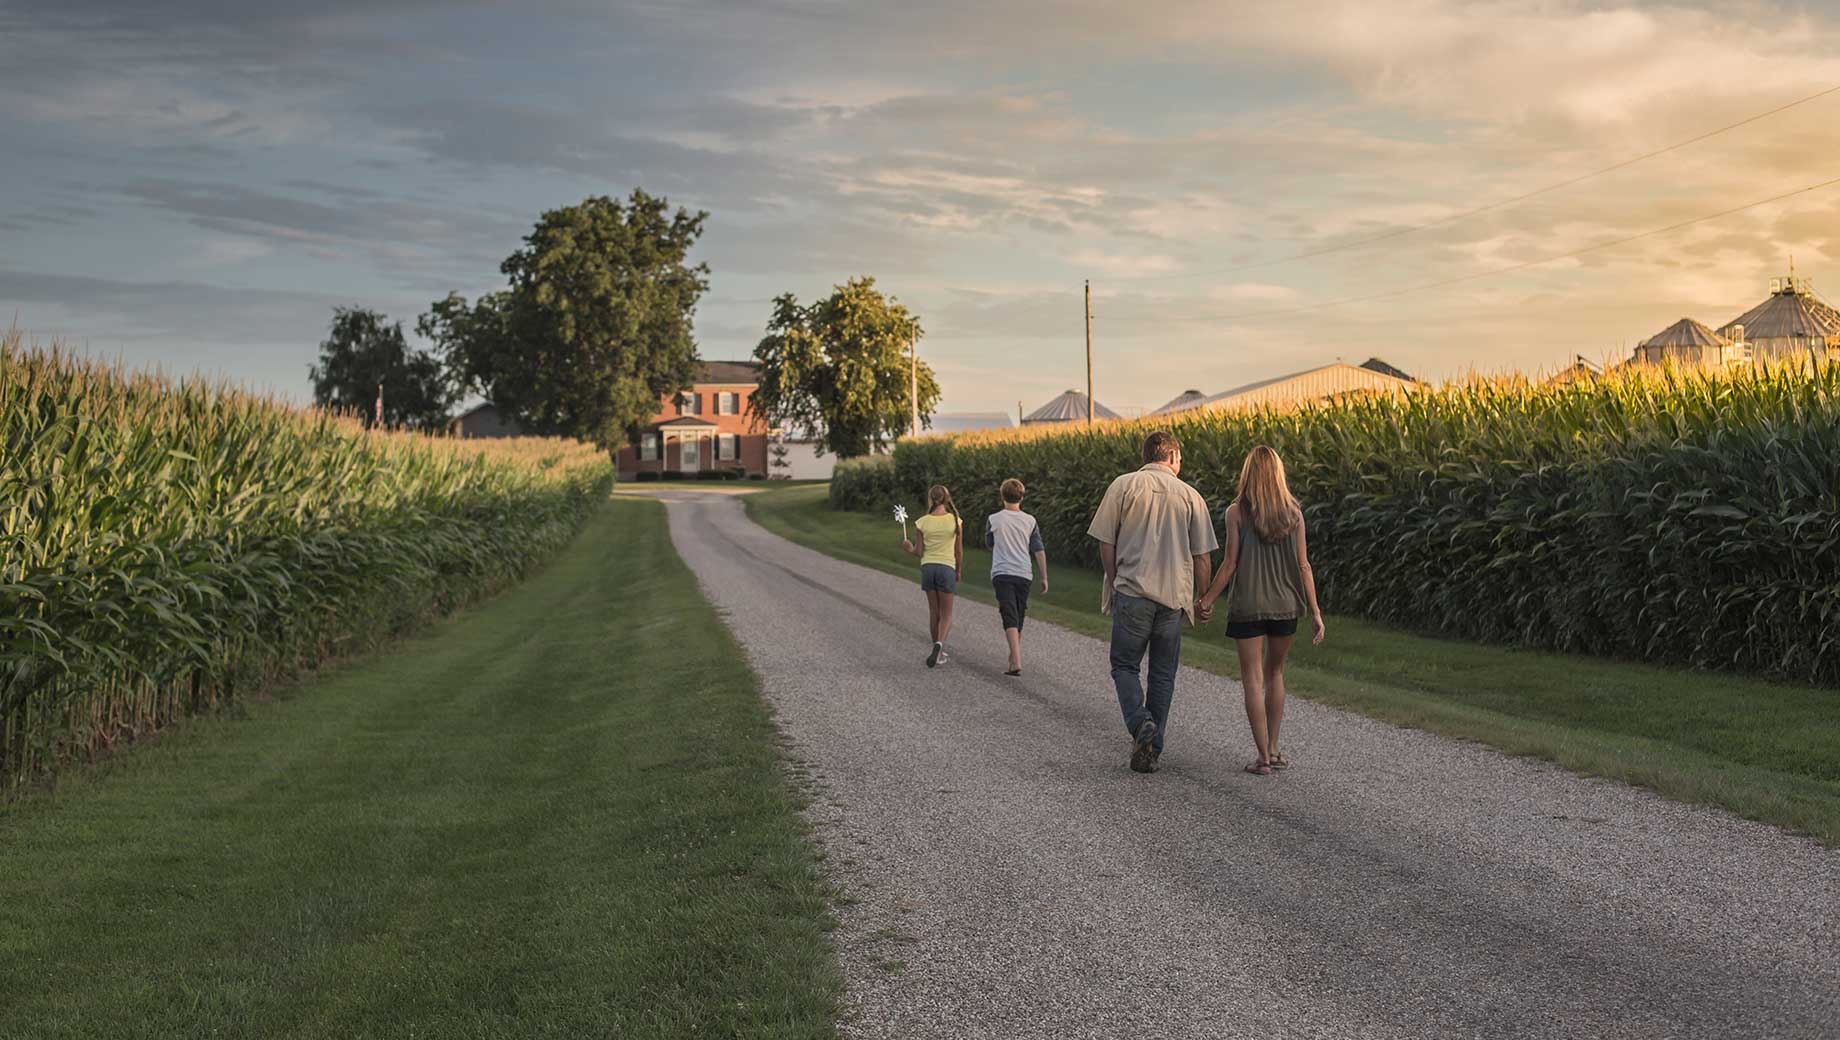
WASHINGTON, D.C. -- About half of Americans (48%) at the end of 2020 said that, if able to live anywhere they wished, they would choose a town (17%) or rural area (31%) rather than a city or suburb. This is a shift from 2018, when 39% thought a town or rural area would be ideal.
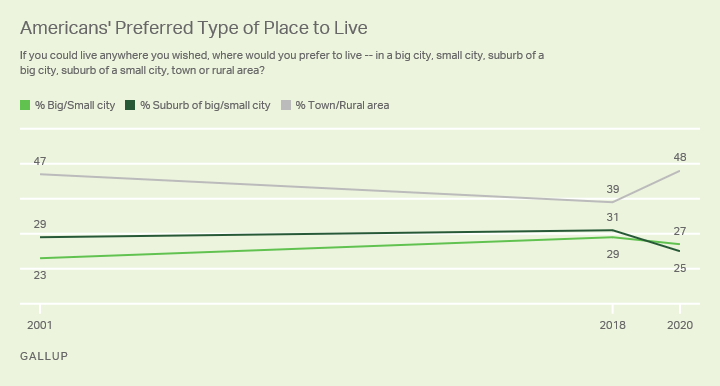
Line graph. The percentage of Americans wishing to live in a town or rural area was 47% in 2001 versus 39% in 2018 and is back at 48% in 2020. A quarter now prefer living in a suburb of a big or small city, down from 31% in 2018, while the percentage preferring to live in a city is fairly steady at 27% today versus 29% in 2018.
The recent increase in Americans' penchant for country living -- those choosing a town or rural area -- has been accompanied by a decline in those preferring to live in a suburb, down six percentage points to 25%. The percentage favoring cities has been steadier, with 27% today -- close to the 29% in 2018 -- saying they would prefer living in a big (11%) or small (16%) city.
Current attitudes are similar to those recorded in October 2001, the only other time Gallup has asked Americans this question. That reading, like today's but unlike the 2018 one, was taken during a time of great national upheaval -- shortly after the 9/11 terrorist attacks, when the public was still on edge about the potential for more terrorism occurring in densely populated areas.
The detailed responses show that both sentiments -- those preferring town or rural living -- are up from what they were two years ago, while those preferring to live in the suburb of a big city are down. Meanwhile, there has been no meaningful change in preferences for living in a small city or the suburb of a small city.
| Oct 19-21, 2001 | Nov 13-18, 2018 | Dec 1-17, 2020 | |||||||||||||||||||||||||||||||||||||||||||||||||||||||||||||||||||||||||||||||||||||||||||||||||
|---|---|---|---|---|---|---|---|---|---|---|---|---|---|---|---|---|---|---|---|---|---|---|---|---|---|---|---|---|---|---|---|---|---|---|---|---|---|---|---|---|---|---|---|---|---|---|---|---|---|---|---|---|---|---|---|---|---|---|---|---|---|---|---|---|---|---|---|---|---|---|---|---|---|---|---|---|---|---|---|---|---|---|---|---|---|---|---|---|---|---|---|---|---|---|---|---|---|---|---|
| % | % | % | |||||||||||||||||||||||||||||||||||||||||||||||||||||||||||||||||||||||||||||||||||||||||||||||||
| Big city | 8 | 12 | 11 | ||||||||||||||||||||||||||||||||||||||||||||||||||||||||||||||||||||||||||||||||||||||||||||||||
| Small city | 15 | 17 | 16 | ||||||||||||||||||||||||||||||||||||||||||||||||||||||||||||||||||||||||||||||||||||||||||||||||
| Suburb of big city | 20 | 21 | 16 | ||||||||||||||||||||||||||||||||||||||||||||||||||||||||||||||||||||||||||||||||||||||||||||||||
| Suburb of small city | 9 | 10 | 9 | ||||||||||||||||||||||||||||||||||||||||||||||||||||||||||||||||||||||||||||||||||||||||||||||||
| Town | 12 | 12 | 17 | ||||||||||||||||||||||||||||||||||||||||||||||||||||||||||||||||||||||||||||||||||||||||||||||||
| Rural area | 35 | 27 | 31 | ||||||||||||||||||||||||||||||||||||||||||||||||||||||||||||||||||||||||||||||||||||||||||||||||
| No opinion | 1 | 1 | * | ||||||||||||||||||||||||||||||||||||||||||||||||||||||||||||||||||||||||||||||||||||||||||||||||
| * = Less than 0.5% | |||||||||||||||||||||||||||||||||||||||||||||||||||||||||||||||||||||||||||||||||||||||||||||||||||
| Gallup | |||||||||||||||||||||||||||||||||||||||||||||||||||||||||||||||||||||||||||||||||||||||||||||||||||
The latest results are based on a Gallup poll conducted Dec. 1-17, nine months into the coronavirus pandemic that has kept Americans in their homes to a significant degree while cutting back on most social and public activities.
City and Suburban Residents Not Sold on Their Locales
On the whole, slim majorities of Americans in cities and suburbs aspire to live elsewhere, whereas three in four town/rural residents are content where they are.
Specifically, just under half of those who live in a city (47%) would prefer city living, while 30% would opt for a town or rural area and 22% a suburb. Similarly, 48% of current suburban residents favor suburban living, while 30% would rather be in a town/rural area and 22% a city.
| Live in a city | Live in a suburb | Live in town/rural area | ||||||||||||||||||||||||||||||||||||||||||||||||||||||||||||||||||||||||||||||||||||||||||||||||||
|---|---|---|---|---|---|---|---|---|---|---|---|---|---|---|---|---|---|---|---|---|---|---|---|---|---|---|---|---|---|---|---|---|---|---|---|---|---|---|---|---|---|---|---|---|---|---|---|---|---|---|---|---|---|---|---|---|---|---|---|---|---|---|---|---|---|---|---|---|---|---|---|---|---|---|---|---|---|---|---|---|---|---|---|---|---|---|---|---|---|---|---|---|---|---|---|---|---|---|---|---|
| % | % | % | ||||||||||||||||||||||||||||||||||||||||||||||||||||||||||||||||||||||||||||||||||||||||||||||||||
| Preferred locale | ||||||||||||||||||||||||||||||||||||||||||||||||||||||||||||||||||||||||||||||||||||||||||||||||||||
| City | 47 | 22 | 12 | |||||||||||||||||||||||||||||||||||||||||||||||||||||||||||||||||||||||||||||||||||||||||||||||||
| Suburb | 22 | 48 | 13 | |||||||||||||||||||||||||||||||||||||||||||||||||||||||||||||||||||||||||||||||||||||||||||||||||
| Town/Rural area | 30 | 30 | 75 | |||||||||||||||||||||||||||||||||||||||||||||||||||||||||||||||||||||||||||||||||||||||||||||||||
| Gallup, Dec. 1-17, 2020 | ||||||||||||||||||||||||||||||||||||||||||||||||||||||||||||||||||||||||||||||||||||||||||||||||||||
Gallup did not measure Americans' current type of community in 2018, but the 2001 results found residents of each type of community more content where they were than is seen today. The slight majority of city residents in 2001 (53%) said they would prefer living in a city, and 67% of suburban residents preferred living in the suburbs. An even higher proportion of town/rural residents than today, 86%, favored living in those areas.
Greater Preference for Town or Rural Life Seen Across Society
Americans' heightened preference since 2018 for living in a town or rural area is seen across demographic groups, including equal proportions of men and women. But three groups -- namely, non-White Americans, Republicans and residents of the South -- have shifted more strongly, with 12- or 13-point increases. The preference for towns or rural areas increased less among residents of the East and middle-aged adults, up just five points each.
| 2001 | 2018 | 2020 | Change since 2018 |
|||||||||||||||||||||||||||||||||||||||||||||||||||||||||||||||||||||||||||||||||||||||||||||||||
|---|---|---|---|---|---|---|---|---|---|---|---|---|---|---|---|---|---|---|---|---|---|---|---|---|---|---|---|---|---|---|---|---|---|---|---|---|---|---|---|---|---|---|---|---|---|---|---|---|---|---|---|---|---|---|---|---|---|---|---|---|---|---|---|---|---|---|---|---|---|---|---|---|---|---|---|---|---|---|---|---|---|---|---|---|---|---|---|---|---|---|---|---|---|---|---|---|---|---|---|---|
| U.S. | 47 | 39 | 48 | +9 | ||||||||||||||||||||||||||||||||||||||||||||||||||||||||||||||||||||||||||||||||||||||||||||||||
| Gender | ||||||||||||||||||||||||||||||||||||||||||||||||||||||||||||||||||||||||||||||||||||||||||||||||||||
| Men | 47 | 45 | 52 | +7 | ||||||||||||||||||||||||||||||||||||||||||||||||||||||||||||||||||||||||||||||||||||||||||||||||
| Women | 46 | 35 | 44 | +9 | ||||||||||||||||||||||||||||||||||||||||||||||||||||||||||||||||||||||||||||||||||||||||||||||||
| Age | ||||||||||||||||||||||||||||||||||||||||||||||||||||||||||||||||||||||||||||||||||||||||||||||||||||
| 18-34 | 37 | 29 | 39 | +10 | ||||||||||||||||||||||||||||||||||||||||||||||||||||||||||||||||||||||||||||||||||||||||||||||||
| 35-54 | 51 | 44 | 49 | +5 | ||||||||||||||||||||||||||||||||||||||||||||||||||||||||||||||||||||||||||||||||||||||||||||||||
| 55+ | 50 | 44 | 52 | +8 | ||||||||||||||||||||||||||||||||||||||||||||||||||||||||||||||||||||||||||||||||||||||||||||||||
| Race | ||||||||||||||||||||||||||||||||||||||||||||||||||||||||||||||||||||||||||||||||||||||||||||||||||||
| White adults | 49 | 45 | 52 | +7 | ||||||||||||||||||||||||||||||||||||||||||||||||||||||||||||||||||||||||||||||||||||||||||||||||
| Non-White adults | 28 | 27 | 39 | +12 | ||||||||||||||||||||||||||||||||||||||||||||||||||||||||||||||||||||||||||||||||||||||||||||||||
| Region | ||||||||||||||||||||||||||||||||||||||||||||||||||||||||||||||||||||||||||||||||||||||||||||||||||||
| East | 48 | 42 | 47 | +5 | ||||||||||||||||||||||||||||||||||||||||||||||||||||||||||||||||||||||||||||||||||||||||||||||||
| Midwest | 54 | 44 | 52 | +8 | ||||||||||||||||||||||||||||||||||||||||||||||||||||||||||||||||||||||||||||||||||||||||||||||||
| South | 44 | 38 | 50 | +12 | ||||||||||||||||||||||||||||||||||||||||||||||||||||||||||||||||||||||||||||||||||||||||||||||||
| West | 40 | 35 | 43 | +8 | ||||||||||||||||||||||||||||||||||||||||||||||||||||||||||||||||||||||||||||||||||||||||||||||||
| Party ID | ||||||||||||||||||||||||||||||||||||||||||||||||||||||||||||||||||||||||||||||||||||||||||||||||||||
| Republicans | 54 | 53 | 66 | +13 | ||||||||||||||||||||||||||||||||||||||||||||||||||||||||||||||||||||||||||||||||||||||||||||||||
| Independents | 48 | 40 | 47 | +7 | ||||||||||||||||||||||||||||||||||||||||||||||||||||||||||||||||||||||||||||||||||||||||||||||||
| Democrats | 37 | 25 | 33 | +8 | ||||||||||||||||||||||||||||||||||||||||||||||||||||||||||||||||||||||||||||||||||||||||||||||||
| Gallup | ||||||||||||||||||||||||||||||||||||||||||||||||||||||||||||||||||||||||||||||||||||||||||||||||||||
In the latest poll, majorities of five demographic groups named country living as their ideal: men, White Americans, adults 55 and older, residents of the Midwest and Republicans. Of these, Republicans were the only one with majority-level preferences for town or rural living in 2018.
The preference for cities is greatest among non-White Americans (34%), adults 18 to 34 (33%), residents of the West (32%) and Democrats (36%).
Partiality to suburbs tops off at 31% among Democrats but registers below 30% for all other groups.
| Big/Small city | Suburb of big/small city |
Town/Rural area | ||||||||||||||||||||||||||||||||||||||||||||||||||||||||||||||||||||||||||||||||||||||||||||||||||
|---|---|---|---|---|---|---|---|---|---|---|---|---|---|---|---|---|---|---|---|---|---|---|---|---|---|---|---|---|---|---|---|---|---|---|---|---|---|---|---|---|---|---|---|---|---|---|---|---|---|---|---|---|---|---|---|---|---|---|---|---|---|---|---|---|---|---|---|---|---|---|---|---|---|---|---|---|---|---|---|---|---|---|---|---|---|---|---|---|---|---|---|---|---|---|---|---|---|---|---|---|
| % | % | % | ||||||||||||||||||||||||||||||||||||||||||||||||||||||||||||||||||||||||||||||||||||||||||||||||||
| U.S. | 27 | 25 | 48 | |||||||||||||||||||||||||||||||||||||||||||||||||||||||||||||||||||||||||||||||||||||||||||||||||
| Gender | ||||||||||||||||||||||||||||||||||||||||||||||||||||||||||||||||||||||||||||||||||||||||||||||||||||
| Men | 24 | 24 | 52 | |||||||||||||||||||||||||||||||||||||||||||||||||||||||||||||||||||||||||||||||||||||||||||||||||
| Women | 29 | 26 | 44 | |||||||||||||||||||||||||||||||||||||||||||||||||||||||||||||||||||||||||||||||||||||||||||||||||
| Race | ||||||||||||||||||||||||||||||||||||||||||||||||||||||||||||||||||||||||||||||||||||||||||||||||||||
| White adults | 24 | 23 | 52 | |||||||||||||||||||||||||||||||||||||||||||||||||||||||||||||||||||||||||||||||||||||||||||||||||
| Non-White adults | 34 | 27 | 39 | |||||||||||||||||||||||||||||||||||||||||||||||||||||||||||||||||||||||||||||||||||||||||||||||||
| Age | ||||||||||||||||||||||||||||||||||||||||||||||||||||||||||||||||||||||||||||||||||||||||||||||||||||
| 18-34 | 33 | 27 | 39 | |||||||||||||||||||||||||||||||||||||||||||||||||||||||||||||||||||||||||||||||||||||||||||||||||
| 35-54 | 24 | 27 | 49 | |||||||||||||||||||||||||||||||||||||||||||||||||||||||||||||||||||||||||||||||||||||||||||||||||
| 55+ | 26 | 22 | 52 | |||||||||||||||||||||||||||||||||||||||||||||||||||||||||||||||||||||||||||||||||||||||||||||||||
| Region | ||||||||||||||||||||||||||||||||||||||||||||||||||||||||||||||||||||||||||||||||||||||||||||||||||||
| East | 24 | 29 | 47 | |||||||||||||||||||||||||||||||||||||||||||||||||||||||||||||||||||||||||||||||||||||||||||||||||
| Midwest | 26 | 22 | 52 | |||||||||||||||||||||||||||||||||||||||||||||||||||||||||||||||||||||||||||||||||||||||||||||||||
| South | 26 | 24 | 50 | |||||||||||||||||||||||||||||||||||||||||||||||||||||||||||||||||||||||||||||||||||||||||||||||||
| West | 32 | 26 | 43 | |||||||||||||||||||||||||||||||||||||||||||||||||||||||||||||||||||||||||||||||||||||||||||||||||
| Party ID | ||||||||||||||||||||||||||||||||||||||||||||||||||||||||||||||||||||||||||||||||||||||||||||||||||||
| Republicans | 17 | 17 | 66 | |||||||||||||||||||||||||||||||||||||||||||||||||||||||||||||||||||||||||||||||||||||||||||||||||
| Independents | 27 | 27 | 47 | |||||||||||||||||||||||||||||||||||||||||||||||||||||||||||||||||||||||||||||||||||||||||||||||||
| Democrats | 36 | 31 | 33 | |||||||||||||||||||||||||||||||||||||||||||||||||||||||||||||||||||||||||||||||||||||||||||||||||
| Gallup, Dec. 1-17, 2020 | ||||||||||||||||||||||||||||||||||||||||||||||||||||||||||||||||||||||||||||||||||||||||||||||||||||
Bottom Line
As 2020 came to an end, close to half of Americans expressed a preference for living in either a town or rural area rather than a city or suburb, a distinct increase from 2018, when about four in 10 thought country living was ideal. Although the two-year gap makes it difficult to pinpoint why, the effect the coronavirus pandemic has had on Americans' lifestyle preferences could very well be a factor. This may also explain why the current results are similar to October 2001, another time when Americans felt under threat in their daily lives.
View complete question responses and trends (PDF download).
Learn more about how the Gallup Poll Social Series works.