Story Highlights
- Estimate has risen more than one percentage point from 2017 update
- Majority of LGBT Americans say they are bisexual
- One in six adults in Generation Z consider themselves LGBT
WASHINGTON, D.C. -- Gallup's latest update on lesbian, gay, bisexual or transgender identification finds 5.6% of U.S. adults identifying as LGBT. The current estimate is up from 4.5% in Gallup's previous update based on 2017 data.
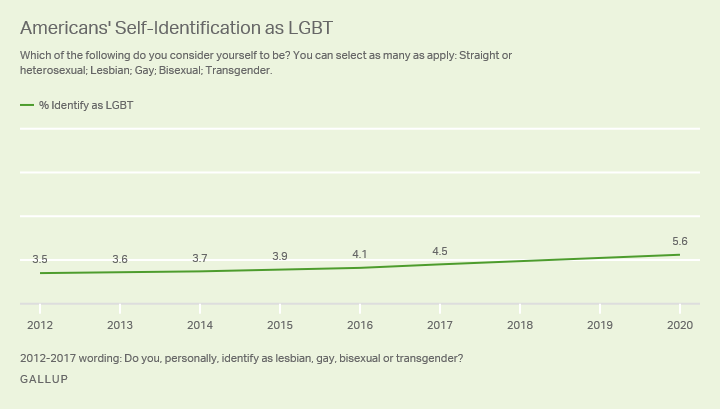
Line graph. Gallup trend in self-identification as lesbian, gay, bisexual or transgender. In 2020, 5.6% of U.S. adults identified as LGBT. That is up from 4.5% in 2017, the last year it was asked, and 4.1% in 2016. Between 2012 and 2015, 3.5% to 3.9% of U.S. adults identified as LGBT.
Currently, 86.7% of Americans say they are heterosexual or straight, and 7.6% do not answer the question about their sexual orientation. Gallup's 2012-2017 data had roughly 5% "no opinion" responses.
The latest results are based on more than 15,000 interviews conducted throughout 2020 with Americans aged 18 and older. Gallup had previously reported annual updates from its 2012-2017 daily tracking survey data, but did not routinely measure LGBT identification in 2018 or 2019.
The identity question asked in 2020 offers a greater level of detail than the question asked in previous years. Now, respondents have the ability to more precisely indicate aspects of their sexual orientation or gender identity. In addition to being able to identify whether they are lesbian, gay, bisexual or straight, respondents may also specifically identify whether they are transgender.
Different approaches to measuring LGBT status can produce varying estimates of its incidence in the U.S. population. Results from Gallup's new question do appear comparable to those from its prior question. The 1.1-percentage-point increase in the 2020 estimate (using the new question) compared with the 2017 estimate (using the old question) is about what would have been predicted from the recent trends. The LGBT percentage rose an average of 0.3 points per year in 2016 and 2017. Assuming that trend continued the past three years, the total increase would have been about one percentage point.
Majority of LGBT Americans Identify as Bisexual
More than half of LGBT adults (54.6%) identify as bisexual. About a quarter (24.5%) say they are gay, with 11.7% identifying as lesbian and 11.3% as transgender. An additional 3.3% volunteer another non-heterosexual preference or term to describe their sexual orientation, such as queer or same-gender-loving. Respondents can give multiple responses when describing their sexual identification; thus, the totals exceed 100%.
Rebasing these percentages to represent their share of the U.S. adult population finds 3.1% of Americans identifying as bisexual, 1.4% as gay, 0.7% as lesbian and 0.6% as transgender.
| Among LGBT U.S. adults | Among all U.S. adults | ||||||||||||||||||||||||||||||||||||||||||||||||||||||||||||||||||||||||||||||||||||||||||||||||||
|---|---|---|---|---|---|---|---|---|---|---|---|---|---|---|---|---|---|---|---|---|---|---|---|---|---|---|---|---|---|---|---|---|---|---|---|---|---|---|---|---|---|---|---|---|---|---|---|---|---|---|---|---|---|---|---|---|---|---|---|---|---|---|---|---|---|---|---|---|---|---|---|---|---|---|---|---|---|---|---|---|---|---|---|---|---|---|---|---|---|---|---|---|---|---|---|---|---|---|---|
| % | % | ||||||||||||||||||||||||||||||||||||||||||||||||||||||||||||||||||||||||||||||||||||||||||||||||||
| Lesbian | 11.7 | 0.7 | |||||||||||||||||||||||||||||||||||||||||||||||||||||||||||||||||||||||||||||||||||||||||||||||||
| Gay | 24.5 | 1.4 | |||||||||||||||||||||||||||||||||||||||||||||||||||||||||||||||||||||||||||||||||||||||||||||||||
| Bisexual | 54.6 | 3.1 | |||||||||||||||||||||||||||||||||||||||||||||||||||||||||||||||||||||||||||||||||||||||||||||||||
| Transgender | 11.3 | 0.6 | |||||||||||||||||||||||||||||||||||||||||||||||||||||||||||||||||||||||||||||||||||||||||||||||||
| Other (e.g., queer, same-gender-loving) | 3.3 | 0.2 | |||||||||||||||||||||||||||||||||||||||||||||||||||||||||||||||||||||||||||||||||||||||||||||||||
| Percentages total more than 100% because respondents may choose more than one category. | |||||||||||||||||||||||||||||||||||||||||||||||||||||||||||||||||||||||||||||||||||||||||||||||||||
| Gallup, 2020 | |||||||||||||||||||||||||||||||||||||||||||||||||||||||||||||||||||||||||||||||||||||||||||||||||||
LGBT Identification Not Uncommon Among Younger Generations
One of the main reasons LGBT identification has been increasing over time is that younger generations are far more likely to consider themselves to be something other than heterosexual. This includes about one in six adult members of Generation Z (those aged 18 to 23 in 2020).
LGBT identification is lower in each older generation, including 2% or less of Americans born before 1965 (aged 56 and older in 2020).
| LGBT | Straight/Heterosexual | No opinion | |||||||||||||||||||||||||||||||||||||||||||||||||||||||||||||||||||||||||||||||||||||||||||||||||
|---|---|---|---|---|---|---|---|---|---|---|---|---|---|---|---|---|---|---|---|---|---|---|---|---|---|---|---|---|---|---|---|---|---|---|---|---|---|---|---|---|---|---|---|---|---|---|---|---|---|---|---|---|---|---|---|---|---|---|---|---|---|---|---|---|---|---|---|---|---|---|---|---|---|---|---|---|---|---|---|---|---|---|---|---|---|---|---|---|---|---|---|---|---|---|---|---|---|---|---|
| % | % | % | |||||||||||||||||||||||||||||||||||||||||||||||||||||||||||||||||||||||||||||||||||||||||||||||||
| Generation Z (born 1997-2002) | 15.9 | 78.9 | 5.2 | ||||||||||||||||||||||||||||||||||||||||||||||||||||||||||||||||||||||||||||||||||||||||||||||||
| Millennials (born 1981-1996) | 9.1 | 82.7 | 8.1 | ||||||||||||||||||||||||||||||||||||||||||||||||||||||||||||||||||||||||||||||||||||||||||||||||
| Generation X (born 1965-1980) | 3.8 | 88.6 | 7.6 | ||||||||||||||||||||||||||||||||||||||||||||||||||||||||||||||||||||||||||||||||||||||||||||||||
| Baby boomers (born 1946-1964) | 2.0 | 91.1 | 6.9 | ||||||||||||||||||||||||||||||||||||||||||||||||||||||||||||||||||||||||||||||||||||||||||||||||
| Traditionalists (born before 1946) | 1.3 | 89.9 | 8.9 | ||||||||||||||||||||||||||||||||||||||||||||||||||||||||||||||||||||||||||||||||||||||||||||||||
| Gallup, 2020 | |||||||||||||||||||||||||||||||||||||||||||||||||||||||||||||||||||||||||||||||||||||||||||||||||||
The vast majority of Generation Z adults who identify as LGBT -- 72% -- say they are bisexual. Thus, 11.5% of all Gen Z adults in the U.S. say they are bisexual, with about 2% each identifying as gay, lesbian or transgender.
About half of millennials (those aged 24 to 39 in 2020) who identify as LGBT say they are bisexual. In older age groups, expressed bisexual preference is not significantly more common than expressed gay or lesbian preference.
| Bisexual | Gay | Lesbian | Transgender | Other | |||||||||||||||||||||||||||||||||||||||||||||||||||||||||||||||||||||||||||||||||||||||||||||||
|---|---|---|---|---|---|---|---|---|---|---|---|---|---|---|---|---|---|---|---|---|---|---|---|---|---|---|---|---|---|---|---|---|---|---|---|---|---|---|---|---|---|---|---|---|---|---|---|---|---|---|---|---|---|---|---|---|---|---|---|---|---|---|---|---|---|---|---|---|---|---|---|---|---|---|---|---|---|---|---|---|---|---|---|---|---|---|---|---|---|---|---|---|---|---|---|---|---|---|---|
| % | % | % | % | % | |||||||||||||||||||||||||||||||||||||||||||||||||||||||||||||||||||||||||||||||||||||||||||||||
| Generation Z (born 1997-2002) | 11.5 | 2.1 | 1.4 | 1.8 | 0.4 | ||||||||||||||||||||||||||||||||||||||||||||||||||||||||||||||||||||||||||||||||||||||||||||||
| Millennials (born 1981-1996) | 5.1 | 2.0 | 0.8 | 1.2 | 0.4 | ||||||||||||||||||||||||||||||||||||||||||||||||||||||||||||||||||||||||||||||||||||||||||||||
| Generation X (born 1965-1980) | 1.8 | 1.2 | 0.7 | 0.2 | 0.1 | ||||||||||||||||||||||||||||||||||||||||||||||||||||||||||||||||||||||||||||||||||||||||||||||
| Baby boomers (born 1946-1964) | 0.3 | 1.2 | 0.4 | 0.2 | 0.0 | ||||||||||||||||||||||||||||||||||||||||||||||||||||||||||||||||||||||||||||||||||||||||||||||
| Traditionalists (born before 1946) | 0.3 | 0.3 | 0.2 | 0.3 | 0.1 | ||||||||||||||||||||||||||||||||||||||||||||||||||||||||||||||||||||||||||||||||||||||||||||||
| Figures represent the percentage of all adult members of each generation who have that sexual orientation | |||||||||||||||||||||||||||||||||||||||||||||||||||||||||||||||||||||||||||||||||||||||||||||||||||
| Gallup, 2020 | |||||||||||||||||||||||||||||||||||||||||||||||||||||||||||||||||||||||||||||||||||||||||||||||||||
In addition to the pronounced generational differences, significant gender differences are seen in sexual identity, as well as differences by people's political ideology:
- Women are more likely than men to identify as LGBT (6.4% vs. 4.9%, respectively).
- Women are more likely to identify as bisexual -- 4.3% do, with 1.3% identifying as lesbian and 1.3% as something else. Among men, 2.5% identify as gay, 1.8% as bisexual and 0.6% as something else.
- 13.0% of political liberals, 4.4% of moderates and 2.3% of conservatives say they are lesbian, gay, bisexual or transgender.
- Differences are somewhat less pronounced by party identification than by ideology, with 8.8% of Democrats, 6.5% of independents and 1.7% of Republicans identifying as LGBT.
- There are no meaningful educational differences -- 5.6% of college graduates and 5.7% of college nongraduates are LGBT.
Bottom Line
At a time when Americans are increasingly supportive of equal rights for gay, lesbian and transgender people, a growing percentage of Americans identify themselves as LGBT. With younger generations far more likely than older generations to consider themselves LGBT, that growth should continue.
The pronounced generational differences raise questions about whether higher LGBT identification in younger than older Americans reflects a true shift in sexual orientation, or if it merely reflects a greater willingness of younger people to identify as LGBT. To the extent it reflects older Americans not wanting to acknowledge an LGBT orientation, the Gallup estimates may underestimate the actual population prevalence of it.
One of the biggest recent advances in LGBT rights was the legalization of same-sex marriage nationwide. Gallup's new estimates on same-sex marriages and domestic partnerships in the U.S. can be found here.
Editor's note: On Feb. 26, 2021, some article text was revised to clarify aspects of sexual orientation versus gender identity.
Learn more about how the Gallup Poll Social Series works.