
Story Highlights
- Approval was at just 4% in 1958, when Gallup first polled on the question
- The racial gap in approval of interracial marriage has nearly closed
- Age and regional gaps in approval have also shrunk
WASHINGTON, D.C. -- Ninety-four percent of U.S. adults now approve of marriages between Black people and White people, up from 87% in the prior reading from 2013. The current figure marks a new high in Gallup's trend, which spans more than six decades. Just 4% approved when Gallup first asked the question in 1958.
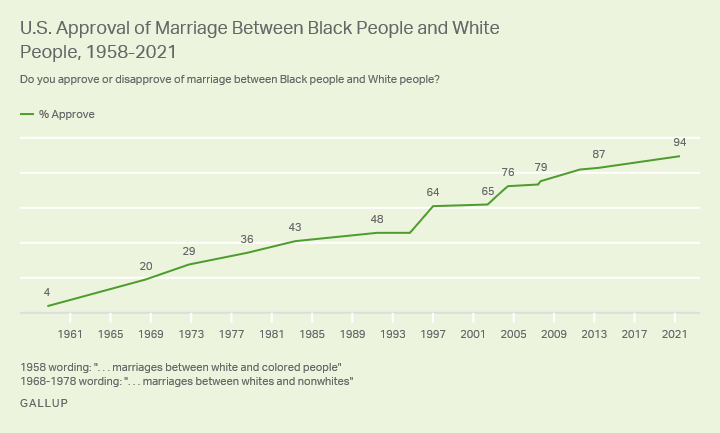
Line graph. The percentages of Americans who approve of marriage between Black people and White people. 94% of Americans in 2021 approve of these unions, a record in Gallup's trend and up from 4% the first time the question was asked in 1958.
The latest figure is from a Gallup poll conducted July 6-21. Shifts in the 63-year-old trend represent one of the largest transformations in public opinion in Gallup's history -- beginning at a time when interracial marriage was nearly universally opposed and continuing to its nearly universal approval today.
The U.S. Supreme Court legalized interracial marriage nationwide in the 1967 Loving v. Virginia case. A year after that decision, Gallup found support for the practice increasing, but still only a small minority of 20% approved.
Approval of interracial marriage continued to grow in the U.S. in periodic readings Gallup took over the following decades, finally reaching majority level in 1997, when support jumped from 48% to 64%. Support has increased in subsequent measures, surpassing 70% in 2003, 80% in 2011 and 90% in the current reading.
White, Non-White Americans Now Similarly Approve of Interracial Marriage
Non-White Americans have been consistently more approving of interracial marriages than White Americans -- but that gap has narrowed over time and, in the latest reading, has nearly closed.
Previous measures from 1968 to 2013 found double-digit gaps in approval between White and Non-White adults. Today, the three percentage points that separate approval among White (93%) and Non-White adults (96%) is within the poll's margin of error.
Recent growth at the national level has been driven by increasing approval among White Americans, as approval among Non-White Americans has been unchanged over the past decade.
Majorities of non-White adults since 1968 have approved of interracial marriage. It was not until 1997 that a majority of White adults held that opinion.
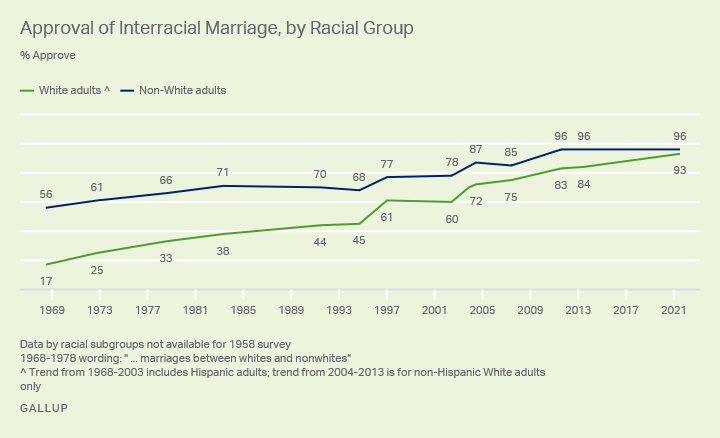
Line graph. Americans' approval of interracial marriage, by racial group. In 2021, 93% of White adults and 96% of Non-White adults approve of interracial marriage, up from 17% and 56%, respectively, in 1968.
Generational Differences in Views on Interracial Marriage Shrink
Younger adults in the U.S. have consistently been more likely than their older peers to approve of marriages between Black people and White people. But these generational differences have shrunk, as older adults are now nearly as supportive of interracial marriages as younger adults are.
But Americans in all age groups today are more supportive of Black-White marriages than adults in the same age group were in the past, particularly among older adults. In 1991, 27% of U.S. adults aged 50 and older approved of interracial marriages, compared with 91% today.
| 1991 | 2002 | 2011 | 2021 | |
|---|---|---|---|---|
| % Approve | % Approve | % Approve | % Approve | |
| 18-29 | 64 | 86 | 97 | 98 |
| 30-49 | 56 | 75 | 91 | 97 |
| 50+ | 27 | 44 | 78 | 91 |
| Gallup | ||||
Regional Differences in Views on Interracial Marriage Now Gone
In previous decades, Americans living in the East, Midwest and West were generally more approving of marriages between Black people and White people than those living in the South.
At this point in the trend, however, approval of interracial marriage is nearly universal across all regions, almost closing the regional gaps that existed in earlier parts of the trend.
| 1991 | 2002 | 2011 | 2021 | |
|---|---|---|---|---|
| % Approve | % Approve | % Approve | % Approve | |
| East | 54 | 67 | 90 | 94 |
| Midwest | 50 | 60 | 86 | 93 |
| South | 33 | 59 | 79 | 93 |
| West | 60 | 79 | 91 | 97 |
| Gallup | ||||
Bottom Line
Americans are now nearly unanimous in their approval of marriages between Black people and White people. The shifts over time document changes in U.S. social mores as well as differing attitudes between current and past generations of Americans.
A similar gradual change can be seen in willingness to vote for a Black presidential candidate, a trend that spans just as much time as Gallup's trend on interracial marriage. While voting for a Black candidate was unpopular in the 1950s, nearly all Americans say they would be willing to do so today. Americans' ideas about marriage, too, have changed. Solid majorities now support same-sex marriage, and larger majorities than in the past view divorce as morally acceptable.
At the same time, Americans have become less likely to say that civil rights for Black Americans have improved, and they have recently become more likely to say that new civil rights laws are needed to reduce discrimination against Black people.
Opposition to interracial marriage still exists, but it is quite small. Future measures will indicate whether 94% is the ceiling for approval, or if there is still room for growth in acceptance.
To stay up to date with the latest Gallup News insights and updates, follow us on Twitter.
Learn more about how the Gallup Poll Social Series works.