Story Highlights
- Preferences shifted from nine-point Democratic advantage to five-point GOP edge
- Average party preferences for all of 2021 similar to past years
- Largest percentage of U.S. adults identify as political independents
WASHINGTON, D.C. -- On average, Americans' political party preferences in 2021 looked similar to prior years, with slightly more U.S. adults identifying as Democrats or leaning Democratic (46%) than identified as Republicans or leaned Republican (43%).
However, the general stability for the full-year average obscures a dramatic shift over the course of 2021, from a nine-percentage-point Democratic advantage in the first quarter to a rare five-point Republican edge in the fourth quarter.
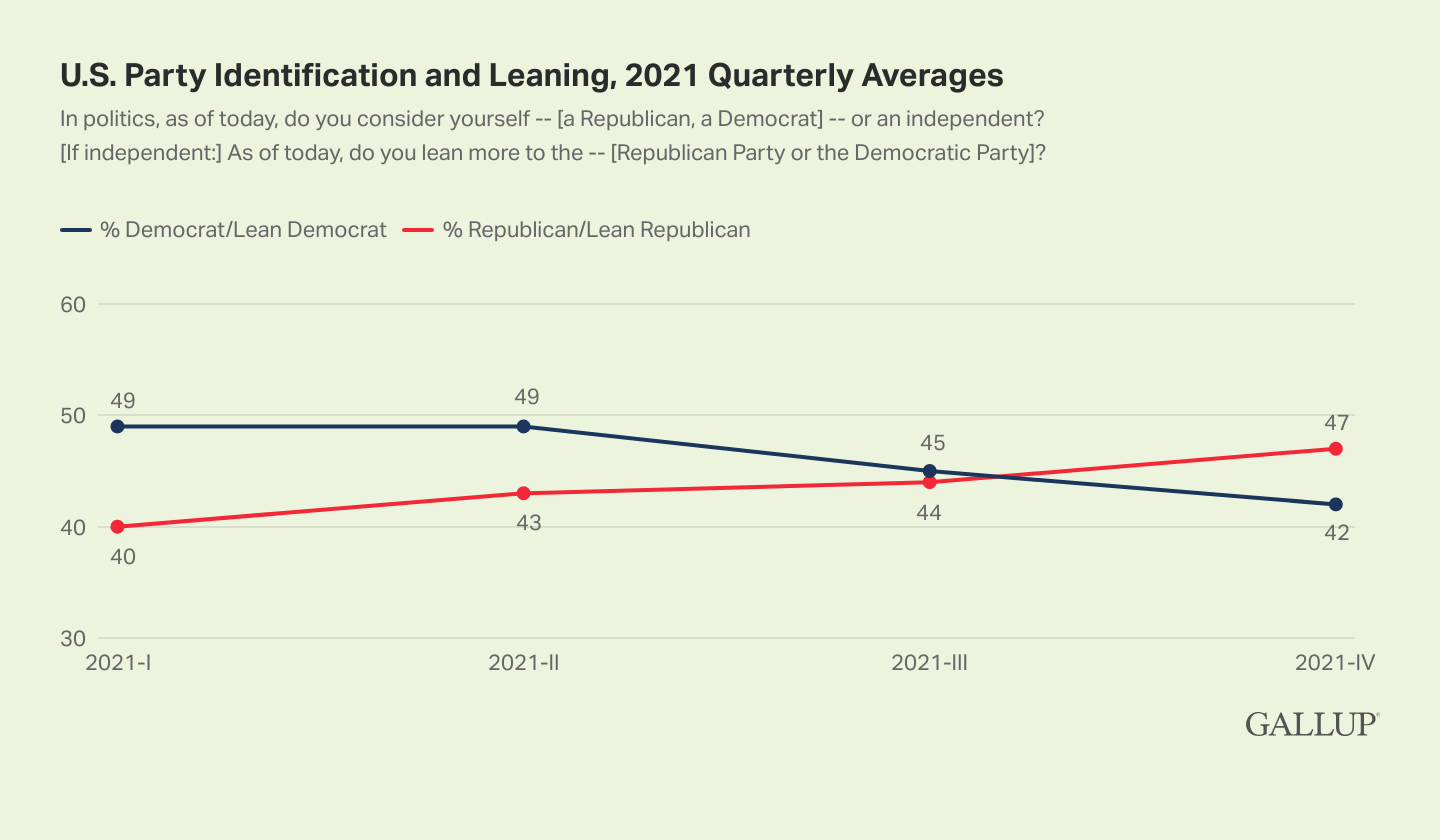
Line graph. Quarterly averages of U.S. party identification and leaning in 2021. In the first quarter of 2021, 49% of U.S. adults identified as Democrats or leaned Democratic, while 40% identified as Republicans or leaned Republican. In the second quarter, 49% were Democrats or Democratic leaners, and 43% were Republicans and Republican leaners. In the third quarter, 45% were Democrats and Democratic leaners, and were 44% Republicans and Republican leaners. In the fourth quarter, 42% were Democrats and Democratic leaners, and 47% were Republicans and Republican leaners.
These results are based on aggregated data from all U.S. Gallup telephone surveys in 2021, which included interviews with more than 12,000 randomly sampled U.S. adults.
Gallup asks all Americans it interviews whether they identify politically as a Republican, a Democrat or an independent. Independents are then asked whether they lean more toward the Republican or Democratic Party. The combined percentage of party identifiers and leaners gives a measure of the relative strength of the two parties politically.
Both the nine-point Democratic advantage in the first quarter and the five-point Republican edge in the fourth quarter are among the largest Gallup has measured for each party in any quarter since it began regularly measuring party identification and leaning in 1991.
-
The Democratic lead in the first quarter was the largest for the party since the fourth quarter of 2012, when Democrats also had a nine-point advantage. Democrats held larger, double-digit advantages in isolated quarters between 1992 and 1999 and nearly continuously between mid-2006 and early 2009.
-
The GOP has held as much as a five-point advantage in a total of only four quarters since 1991. The Republicans last held a five-point advantage in party identification and leaning in early 1995, after winning control of the House of Representatives for the first time since the 1950s. Republicans had a larger advantage only in the first quarter of 1991, after the U.S. victory in the Persian Gulf War led by then-President George H.W. Bush.
Party Preference Shifts Follow Changes in Presidential Approval
Shifting party preferences in 2021 are likely tied to changes in popularity of the two men who served as president during the year. Republican Donald Trump finished out his single term in January, after being defeated in the 2020 election, with a 34% job approval rating, the lowest of his term. His popularity fell more than 10 points from Election Day 2020 as the country's COVID-19 infections and deaths reached then-record highs, he refused to acknowledge the result of the election, and his supporters rioted at the U.S. Capitol on Jan. 6, 2021, in an attempt to prevent Congress from counting the 2020 Electoral College votes.
Democrat Joe Biden enjoyed relatively high ratings after taking office on Jan. 20, and his approval stayed high through the early summer as COVID-19 infections dramatically decreased after millions of Americans got vaccinated against the disease. A summer surge of infections tied to the delta variant of the coronavirus made it clear the pandemic was not over in the U.S., and Biden's approval ratings began to sag. Later, the chaotic U.S. withdrawal from Afghanistan caused Biden's ratings to fall further, into the low 40s. His ratings remain low as the U.S. battles rising inflation and yet another surge of COVID-19 infections, tied to the omicron variant of the virus.
With Trump's approval rating at a low point and Biden relatively popular in the first quarter, 49% of Americans identified as Democrats or leaned Democratic, compared with 40% who were Republicans or Republican leaners.
In the second quarter, Democratic affiliation stayed high, while Republican affiliation began to recover, increasing to 43%.
The third quarter saw a decline in Democratic identification and leaning, from 49% to 45%, as Biden's ratings began to falter, while there was no meaningful change in Republican affiliation.
In the fourth quarter, party support flipped as Republicans made gains, from 44% to 47%, and Democratic affiliation fell from 45% to 42%. These fourth-quarter shifts coincided with strong GOP performances in 2021 elections, including a Republican victory in the Virginia gubernatorial election and a near-upset of the Democratic incumbent governor in New Jersey. Biden won both states by double digits in the 2020 election.
The GOP advantage may be starting to ease, however, as Gallup's latest monthly estimate, from December, showed the two parties about even -- 46% Republican/Republican leaning and 44% Democratic/Democratic leaning.
2021 Shifts Occurred Among Both Core Party Identifiers and Less Attached Leaners
The shifts in party affiliation in each quarter of 2021 were apparent in both the percentage identifying with each party and the percentage of independents leaning to each party, but with more changes among leaners than identifiers.
Between the first and fourth quarters, the percentage of Democratic identifiers decreased by two points, while the percentage of Democratic-leaning independents dropped five points. Republican identification increased by three points from the beginning to the end of 2021, while Republican leaners increased by four points.
| 2021-I | 2021-II | 2021-III | 2021-IV | |
|---|---|---|---|---|
| % | % | % | % | |
| Democrat | 30 | 31 | 28 | 28 |
| Democratic-leaning independent | 19 | 18 | 17 | 14 |
| Non-leaning independent | 10 | 5 | 8 | 9 |
| Republican-leaning independent | 15 | 17 | 16 | 19 |
| Republican | 25 | 26 | 28 | 28 |
| Percentage with no opinion not shown | ||||
| Gallup | ||||
Democrats Usually Hold an Advantage, and Did So in 2021
When all the 2021 shifts are netted out, the Democrats' average three-point advantage for the entirety of the year is only slightly smaller than they had in recent years. Democrats held five- or six-point advantages in party affiliation each year between 2016 and 2020, and three-point edges in 2014 and 2015.
Gallup began regularly measuring party leaning in 1991, and in most years, significantly more Americans have identified as Democrats or as independents who lean Democratic than as Republicans or Republican leaners. The major exception was 1991, when Republicans held a 48% to 44% advantage in party identification and leaning. From 2001 through 2003 and in 2010 and 2011, the parties had roughly equal levels of support.
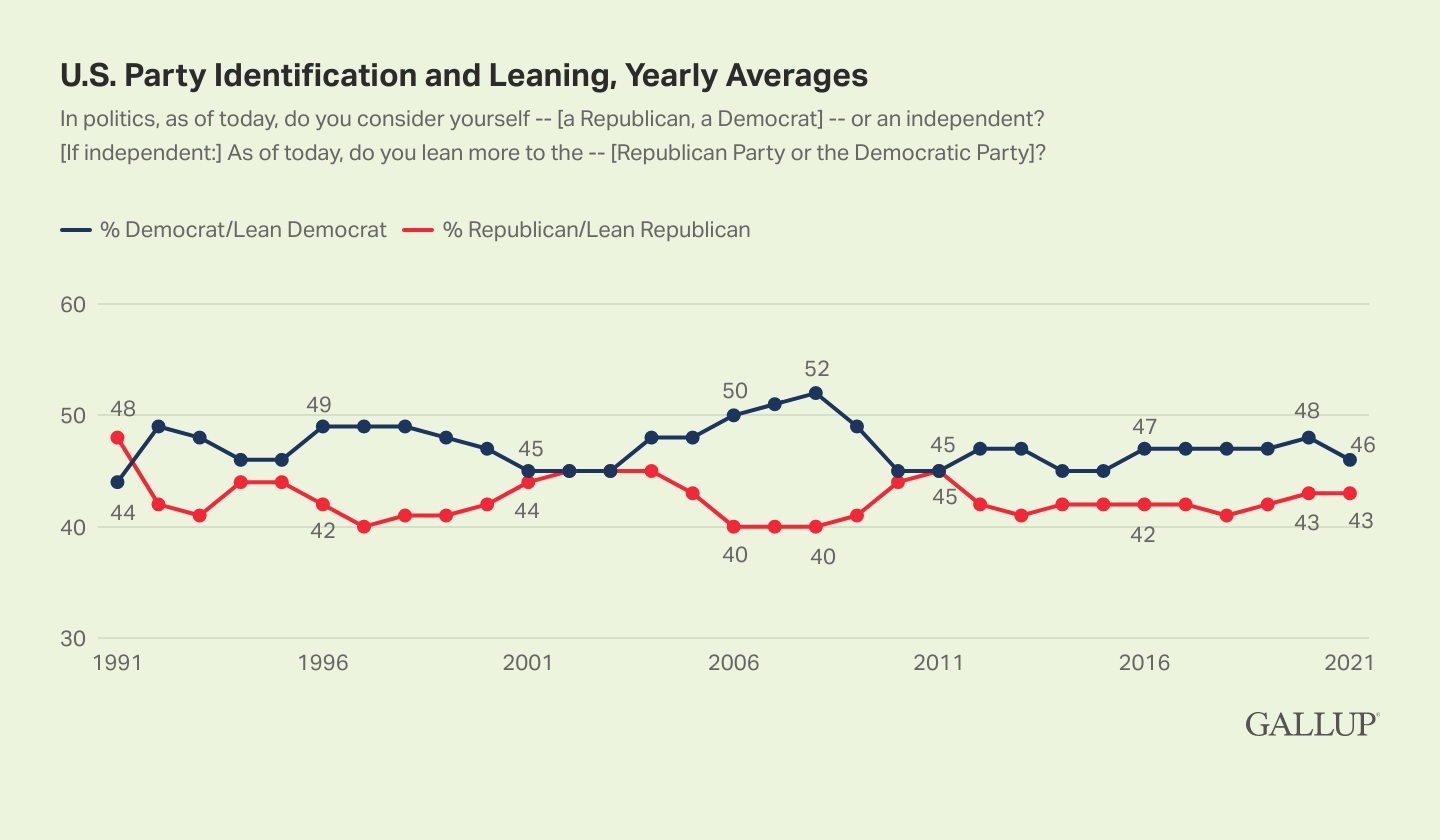
Line graph. Yearly averages of U.S. party identification and leaning between 1991 and 2021. In most years, more Americans have identified as Democrats or leaned Democratic than have identified as Republican or leaned Republican. Republicans had an advantage only in 1991, 48% to 44%. Democrats' largest advantage was in 2008, 52% to 40%.
Independents Are Still the Largest Political Group in the U.S.
Regardless of which party has an advantage in party affiliation, over the past three decades, presidential elections have generally been competitive, and party control of the U.S. House of Representatives and Senate has changed hands numerous times. This is partly because neither party can claim a very high share of core supporters -- those who identify with the party -- as the largest proportion of Americans identify initially as political independents.
Overall in 2021, an average of 29% of Americans identified as Democrats, 27% as Republicans and 42% as independents. Roughly equal proportions of independents leaned to the Democratic Party (17%) and to the Republican Party (16%).
The percentage of independent identifiers is up from 39% in 2020, but similar to the 41% measured in 2019. Gallup has often seen a decrease in independents in a presidential election year and an increase in the year after.
The broader trend toward an increasing share of political independents has been clear over the past decade, with more Americans viewing themselves as independents than did so in the late 1980s through 2000s. At least four in 10 Americans have considered themselves independents in all years since 2011, except for the 2016 and 2020 presidential election years. Before 2011, independent identification had never reached 40%.
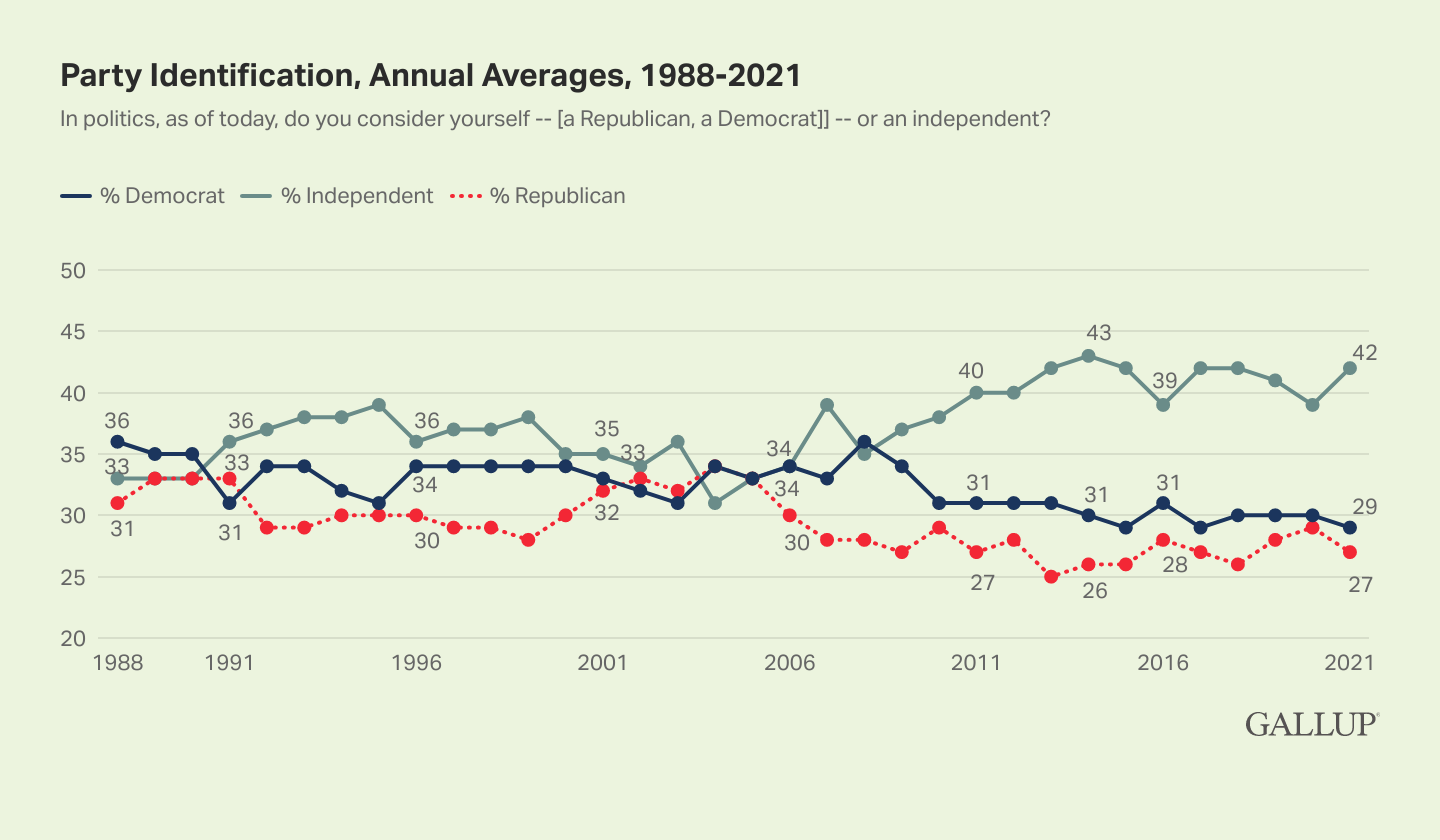
Line graph. Annual averages in party identification, 1988 through 2021. Since 1998, more Americans have typically identified as Democrats than as Republicans. Over the past decade, independents have significantly outnumbered supporters of either party.
Bottom Line
The year 2021 was an eventful one in politics, after a similarly eventful 2020 that also saw major shifts in party preferences. In early 2021, Democratic strength reached levels not seen in nearly a decade. By the third quarter, those Democratic gains evaporated as Biden's job approval declined. The political winds continued to become more favorable to Republicans in the fourth quarter, giving the GOP an advantage over Democrats larger than any they had achieved in more than 25 years.
The final monthly survey of 2021 showed the parties at roughly even strength, although that still represents a departure from the historical norm of the Democratic Party's having at least a slight advantage in party affiliation.
With control of the House of Representatives and Senate at stake in this year's midterm elections, party preferences will be a key indicator of which party will be better positioned to gain majorities in the next session of Congress.
To stay up to date with the latest Gallup News insights and updates, follow us on Twitter.
Learn more about how the Gallup Poll Social Series works.