GALLUP NEWS SERVICE
PRINCETON, NJ -- Gallup's 2002 Earth Day survey finds little change over the past year in Americans' general evaluation of the environment. According to the March 4-7 poll, the public is essentially divided about whether or not the environment is in good shape and whether or not it is improving, with pessimists tending to outnumber optimists on both scores. A question that asks Americans to rate their concern about a number of specific environmental issues finds water-related issues, particularly pollution of drinking water, at the top of public concerns. However, concern about most environmental issues has declined over the past year, possibly due to the economy and terrorism consuming more of the public's attention today.
Rating Environmental Quality
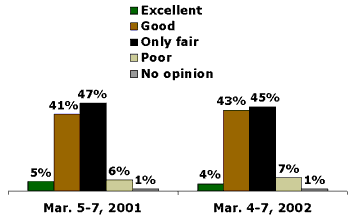
The latest poll shows that Americans are slightly more negative than positive about the current state of the nation's environment. Forty-seven percent of Americans rate the quality of the environment today as either "excellent" or "good," while 52% rate conditions as "only fair" or "poor." These findings have remained essentially unchanged over the past year.
| How would you rate the overall quality of the environment in this country today -- as excellent, good, only fair, or poor? |
 |
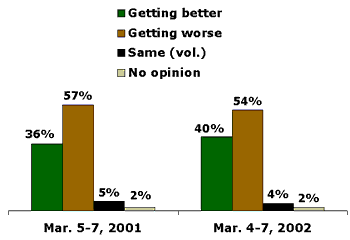
Even though Americans are closely divided about the quality of current conditions, they are more definitive when asked about the future. A majority of adults, 54%, say the quality of the environment is getting worse, while just 40% say it is getting better. This environmental forecast is just slightly improved over last year when 57% perceived environmental conditions to be getting worse, and just 36% said they were getting better.
| Right now, do you think the quality of the environment in the country as a whole is getting better or getting worse? |
 |
Certain groups of people are more apt to think the quality of the environment is getting worse.
- Women are more likely than men to take this view, by a margin of 58% to 49%.
- Two-thirds of Democrats (67%) feel conditions in the environment are getting worse, compared to 57% of independents and only 40% of Republicans.
- Seven in 10 liberals say the quality of the environment is getting worse. This compares to 56% of moderates and 43% of conservatives.
When combining respondents' answers to the two environmental ratings questions, Gallup finds the public split into three groups:
- Roughly three in 10 Americans (29%) have a positive environmental outlook, saying that that current conditions are either excellent or good, and predicting that those conditions will be maintained or will improve in the future.
- Close to four in 10 national adults (38%) have negative environmental views, describing current conditions as "only fair" or poor, and predicting this situation will continue or worsen.
- The rest (31%) are more mixed in their outlooks -- for instance, describing current conditions as poor, but predicting they will improve.
Americans Not Too Optimistic About Solving Environmental Problems
A different pair of questions asked Americans to assess the amount of progress the country has made in dealing with the environment over the past 20 years, and to express how optimistic they are that progress will be made in the next 20 years. Most Americans fall into the middle position on both questions, saying "some" progress has been made and that they have "only some" optimism that progress will be made.
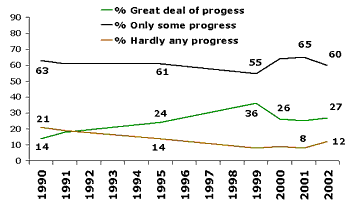
In general, Americans are more positive about the progress made over the past 20 years than they are optimistic about what will happen in the future. In rating past efforts, 60% of Americans believe that just some progress has been made in dealing with environmental problems over the past two decades. At the outer extremes, positive reviews outnumber negative reviews by more than two to one. One-quarter of Americans, 27%, say that a great deal of progress has been made, while just 12% think there has been "hardly any" progress.
A majority of people have consistently said only some progress has been made since Gallup first asked this question in 1990. From 1990 through 1995, roughly six in 10 Americans shared this point of view. The percentage of Americans who mentioned "only some progress" declined to 55% in 1999 but then increased to 64% in 2000 and 65% in 2001. No more than one-third of the public has ever felt that a "great deal of progress" has been made in solving environmental problems.
| How much progress do you think has been made in dealing with environmental problems over the past 20 years? Would you say there has been a great deal of progress, only some progress, or hardly any progress at all? |
 |
The public is even less optimistic that environmental problems will be under control in the next 20 years. The poll finds that 61% of those surveyed have only some optimism about remedying environmental problems in the future, while 21% have hardly any optimism. Another 17% say they have a great deal of optimism. Americans' level of optimism has been relatively stable since April 1990.
| How much optimism do you have that we will have our environmental problems well under control in 20 years -- that is, by about 2022 -- a great deal of optimism, only some optimism, or hardly any optimism at all? |
 |
Public Worries Most About Water Pollution
In Gallup's Earth Day poll, Americans were asked to assess their level of concern about a variety of specific environmental problems in the world today. The findings reveal that problems relating to water are at the forefront of the public's environmental concerns.
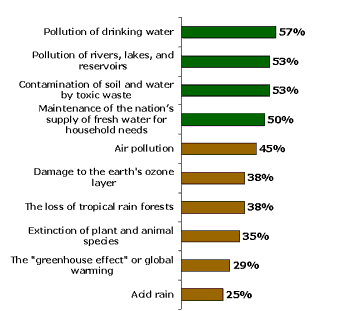
Pollution of drinking water ranks at the top of the list, with 57% of adults saying they worry a great deal about this issue. Pollution of rivers, lakes, and reservoirs and contamination of soil and water by toxic waste follow closely in second place, with 53% of Americans expressing a great deal of worry for each of the two issues. Half of all Americans express a great deal of concern about maintaining the nation's supply of fresh water for household needs, an issue of particular concern this year because of widespread drought conditions across the country.
Americans are somewhat less concerned about air pollution, but a substantial 45% of the public conveys a great deal of anxiety about this issue.
The public is considerably less concerned about issues that do not directly impact its health or daily lives in the short term, even though some argue that these issues might have calamitous implications in the long run. Fewer than four in 10 Americans worry a great deal about damage to the earth's ozone layer, the loss of tropical rain forests, or extinction of plant and animal species. Roughly three in 10 Americans are highly concerned about the "greenhouse effect" or global warming, and only one in four express a great deal of concern about acid rain.
| I'm going to read you a list of environmental
problems. As I read each one, please tell me if you personally
worry about this problem a great deal, a fair amount, only a
little, or not at all. Based on Percentage Who Worry a "Great Deal" |
 |
Even though a majority of people are concerned about several of these issues, Americans today are less worried about this specific list of environmental problems than they have been in recent years. In fact, the only problem that Americans are more concerned about today than in the past is the maintenance of the nation's supply of fresh water for household needs -- no doubt due to the current drought conditions in many parts of the country.
Public concern on a number of issues was much higher when Gallup first asked about them in the late 1980s and early 1990s. Much lower levels of concern first became evident around 1997. Concern generally continues to be lower today. The issues for which this pattern is most apparent include pollution of rivers, lakes, and reservoirs; air pollution; contamination of soil and water by toxic waste; acid rain; damage to the earth's ozone layer; and pollution of drinking water.
Survey Methods
These results are based on telephone interviews with a randomly selected national sample of 1,006 adults, 18 years and older, conducted March 4-7, 2002. For results based on this sample, one can say with 95 percent confidence that the maximum error attributable to sampling and other random effects is plus or minus 3 percentage points. In addition to sampling error, question wording and practical difficulties in conducting surveys can introduce error or bias into the findings of public opinion polls.
How would you rate the overall quality of the environment in this country today -- as excellent, good, only fair, or poor?
|
Excellent |
Good |
Only fair |
Poor |
No opinion |
|
|
2002 Mar 4-7 |
4% |
43 |
45 |
7 |
1 |
|
2001 Mar 5-7 |
5% |
41 |
47 |
6 |
1 |
Right now, do you think the quality of the environment in the country as a whole is getting better or getting worse?
|
Getting better |
Getting worse |
SAME (vol.) |
No opinion |
|
|
2002 Mar 4-7 |
40% |
54 |
4 |
2 |
|
2001 Mar 5-7 |
36% |
57 |
5 |
2 |
|
(vol.) Volunteered response |
||||
ENVIRONMENTAL OUTLOOK GROUPS
|
Positive |
Mixed |
Negative |
Undesignated |
|
|
2002 Mar 4-7 |
29% |
31 |
38 |
2 |
|
2001 Mar 5-7 |
24% |
34 |
39 |
3 |
How much progress do you think has been made in dealing with environmental problems over the past twenty years? Would you say there has been a great deal of progress, only some progress, or hardly any progress at all?
|
Great deal of progress |
Only some |
Hardly any |
No |
||
|
% |
% |
% |
% |
||
|
2002 Mar 4-7 |
27 |
60 |
12 |
1 |
|
|
2001 Mar 5-7 ^ |
25 |
65 |
8 |
2 |
|
|
2000 Apr 3-9 † |
26 |
64 |
9 |
1 |
|
|
1999 Apr 13-14 † |
36 |
55 |
8 |
1 |
|
|
1995 Apr 17-19 † |
24 |
61 |
14 |
1 |
|
|
1991 Apr 11-14 † |
18 |
61 |
19 |
1 |
|
|
1990 Apr 5-8 † |
14 |
63 |
21 |
2 |
|
|
^ |
Asked of a half sample. |
||||
|
† |
WORDING: How much progress have we made in dealing with environmental problems in the past few decades--say since 1970? Would you say we have made a great deal of progress, only some progress, or hardly any progress at all? |
||||
How much optimism do you have that we will have our environmental problems well under control in twenty years -- that is, by about 2022 -- a great deal of optimism, only some optimism, or hardly any optimism at all?
[BASED ON -- 529 -- NATIONAL ADULTS IN FORM A; ±5 PCT. PTS.]
|
Great deal of optimism |
Only some optimism |
Hardly any optimism |
No |
||
|
% |
% |
% |
% |
||
|
2002 Mar 4-7 |
17 |
61 |
21 |
1 |
|
|
2001 Mar 5-7 ^ † |
15 |
65 |
19 |
1 |
|
|
2000 Apr 3-9 ^ † |
18 |
60 |
21 |
1 |
|
|
1999 Apr 13-14 ^ ‡ |
18 |
62 |
18 |
2 |
|
|
1991 Apr 11-14 ^ ? |
19 |
60 |
18 |
2 |
|
|
1990 Apr 5-8 ^ ? |
18 |
58 |
22 |
2 |
|
|
^ |
Asked of a full sample. |
||||
|
† |
WORDING: How much optimism do you have that we will have our environmental problems well under control in twenty years--that is, by about 2020 -- a great deal of optimism, only some optimism, or hardly any optimism at all? |
||||
|
‡ |
WORDING: How much optimism do you have that we will have our environmental problems well under control in twenty years -- that is, by the year 2019 -- a great deal of optimism, only some optimism, or hardly any optimism at all? |
||||
|
? |
WORDING: How much optimism do you have that we will have our environmental problems well under control in twenty years -- that is, by the year 2011 -- a great deal of optimism, only some optimism, or hardly any optimism at all? |
||||
|
? |
WORDING: How much optimism do you have that we will have our environmental problems well under control in twenty years -- that is, by the year 2010 -- a great deal of optimism, only some optimism, or hardly any optimism at all? |
||||
How much optimism do you have that we will have our environmental problems well under control in twenty years -- a great deal of optimism, only some optimism, or hardly any optimism at all?
[BASED ON -- 496 -- NATIONAL ADULTS IN FORM B; ±5 PCT. PTS.]
|
Great deal of optimism |
Only some optimism |
Hardly any optimism |
No |
|
|
2002 Mar 4-7 |
20% |
54 |
25 |
1 |
I'm going to read you a list of environmental problems. As I read each one, please tell me if you personally worry about this problem a great deal, a fair amount, only a little, or not at all. First, how much do you personally worry about -- [RANDOM ORDER]?
A. Pollution of rivers, lakes, and reservoirs
|
Great |
Fair |
Only a |
Not |
No |
|
|
% |
% |
% |
% |
% |
|
|
2002 Mar 4-7 |
53 |
32 |
12 |
3 |
* |
|
2001 Mar 5-7 |
58 |
29 |
10 |
3 |
* |
|
2000 Apr 3-9 |
66 |
24 |
8 |
2 |
* |
|
1999 Apr 13-14 |
61 |
30 |
7 |
2 |
* |
|
1999 Mar 12-14 |
55 |
30 |
12 |
3 |
* |
|
1991 Apr 11-14 |
67 |
21 |
8 |
3 |
1 |
|
1990 Apr 5-8 |
64 |
23 |
9 |
4 |
-- |
|
1989 May 4-7 |
72 |
19 |
5 |
3 |
1 |
B. Air pollution
|
Great |
Fair |
Only a |
Not |
No |
|
|
% |
% |
% |
% |
% |
|
|
2002 Mar 4-7 |
45 |
33 |
18 |
4 |
* |
|
2001 Mar 5-7 |
48 |
34 |
14 |
4 |
* |
|
2000 Apr 3-9 |
59 |
29 |
9 |
3 |
* |
|
1999 Apr 13-14 |
52 |
35 |
10 |
3 |
* |
|
1999 Mar 12-14 |
47 |
33 |
16 |
4 |
* |
|
1997 Oct 27-28 |
42 |
34 |
18 |
5 |
1 |
|
1991 Apr 11-14 |
59 |
28 |
10 |
4 |
* |
|
1990 Apr 5-8 |
58 |
29 |
9 |
4 |
* |
|
1989 May 4-7 |
63 |
24 |
8 |
4 |
* |
C. Damage to the earth's ozone layer
|
Great |
Fair |
Only a |
Not |
No |
|
|
% |
% |
% |
% |
% |
|
|
2002 Mar 4-7 |
38 |
29 |
21 |
11 |
1 |
|
2001 Mar 5-7 |
47 |
28 |
16 |
8 |
1 |
|
2000 Apr 3-9 |
49 |
29 |
14 |
7 |
1 |
|
1999 Apr 13-14 |
44 |
32 |
15 |
8 |
1 |
|
1997 Oct 27-28 |
33 |
27 |
25 |
13 |
2 |
|
1991 Apr 11-14 |
49 |
24 |
16 |
8 |
4 |
|
1990 Apr 5-8 |
43 |
28 |
15 |
10 |
4 |
|
1989 May 4-7 |
51 |
26 |
13 |
8 |
2 |
D. The loss of tropical rain forests
|
Great |
Fair |
Only a |
Not |
No |
|
|
% |
% |
% |
% |
% |
|
|
2002 Mar 4-7 |
38 |
27 |
21 |
12 |
2 |
|
2001 Mar 5-7 |
44 |
32 |
15 |
8 |
1 |
|
2000 Apr 3-9 |
51 |
25 |
14 |
9 |
1 |
|
1999 Apr 13-14 |
49 |
30 |
14 |
6 |
1 |
|
1991 Apr 11-14 |
42 |
25 |
21 |
10 |
2 |
|
1990 Apr 5-8 |
40 |
24 |
19 |
14 |
3 |
|
1989 May 4-7 |
42 |
25 |
18 |
12 |
3 |
E. The "greenhouse effect" or global warming
|
Great |
Fair |
Only a |
Not |
No |
|
|
% |
% |
% |
% |
% |
|
|
2002 Mar 4-7 |
29 |
29 |
23 |
17 |
2 |
|
2001 Mar 5-7 |
33 |
30 |
22 |
13 |
2 |
|
2000 Apr 3-9 |
40 |
32 |
15 |
12 |
1 |
|
1999 Apr 13-14 |
34 |
34 |
18 |
12 |
2 |
|
1999 Mar 12-14 |
28 |
31 |
23 |
16 |
2 |
|
1997 Oct 27-28 |
24 |
26 |
29 |
17 |
4 |
|
1991 Apr 11-14 |
35 |
27 |
22 |
12 |
5 |
|
1990 Apr 5-8 |
30 |
27 |
20 |
16 |
6 |
|
1989 May 4-7 |
35 |
28 |
18 |
12 |
7 |
F. Contamination of soil and water by toxic waste
|
Great |
Fair |
Only a |
Not |
No |
|
|
% |
% |
% |
% |
% |
|
|
2002 Mar 4-7 |
53 |
29 |
15 |
3 |
* |
|
2001 Mar 5-7 |
58 |
27 |
12 |
3 |
* |
|
2000 Apr 3-9 |
64 |
25 |
7 |
4 |
* |
|
1999 Apr 13-14 |
63 |
27 |
7 |
3 |
* |
|
1999 Mar 12-14 |
55 |
29 |
11 |
5 |
* |
|
1991 Apr 11-14 |
62 |
21 |
11 |
5 |
1 |
|
1990 Apr 5-8 |
63 |
22 |
10 |
5 |
* |
|
1989 May 4-7 |
69 |
21 |
6 |
3 |
* |
G. Acid rain
|
Great |
Fair |
Only a |
Not |
No |
|
|
% |
% |
% |
% |
% |
|
|
2002 Mar 4-7 |
25 |
23 |
31 |
19 |
2 |
|
2001 Mar 5-7 |
28 |
28 |
26 |
16 |
2 |
|
2000 Apr 3-9 |
34 |
31 |
19 |
15 |
1 |
|
1999 Apr 13-14 |
29 |
35 |
23 |
11 |
2 |
|
1991 Apr 11-14 |
34 |
30 |
20 |
14 |
3 |
|
1990 Apr 5-8 |
34 |
30 |
18 |
14 |
4 |
|
1989 May 4-7 |
41 |
27 |
19 |
11 |
3 |
H. Pollution of drinking water
|
Great |
Fair |
Only a |
Not |
No |
|
|
% |
% |
% |
% |
% |
|
|
2002 Mar 4-7 |
57 |
25 |
13 |
5 |
* |
|
2001 Mar 5-7 |
64 |
24 |
9 |
3 |
* |
|
2000 Apr 3-9 |
72 |
20 |
6 |
2 |
* |
|
1999 Apr 13-14 |
68 |
22 |
7 |
3 |
* |
|
1991 Apr 11-4 |
67 |
19 |
10 |
3 |
1 |
|
1990 Apr 5-8 |
65 |
22 |
9 |
4 |
* |
I. Extinction of plant and animal species
|
Great |
Fair |
Only a |
Not |
No |
|
|
2002 Mar 4-7 |
35% |
30 |
22 |
12 |
1 |
|
2001 Mar 5-7 |
43% |
30 |
19 |
7 |
1 |
|
2000 Apr 3-9 |
45% |
33 |
14 |
8 |
* |
J. Maintenance of the nation's supply of fresh water for household needs
|
Great |
Fair |
Only a |
Not |
No |
|
|
2002 Mar 4-7 |
50% |
28 |
17 |
5 |
* |
|
2001 Mar 5-7 |
35% |
34 |
19 |
10 |
2 |
|
2000 Apr 3-9 |
42% |
31 |
14 |
12 |
1 |
|
* Less than 0.5% |
|||||
