Story Highlights
- Millennials compared prices and deals online more this past year
- Millennials are more likely to engage in less-thrifty behaviors
- Impulse, big-ticket purchases rose notably among millennials
This article is the second in a two-part series on the millennial generation's spending habits.
The millennial generation's relationship with spending and saving? It's complicated.
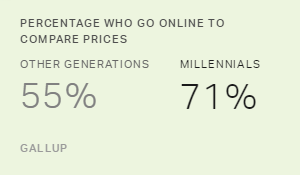
Americans use a variety of methods to handle saving or spending money. With a few exceptions, Gallup discovered that across six different polling periods, millennials were more likely to have engaged in most of the spending and saving behaviors asked about than were members of the other generations. These findings present something of a paradox, however, because some of the behaviors are less thrifty than others. On the thrifty side of the ledger, around seven in 10 millennials have gone online to compare prices (71%), while this is true of more than half of other generations (55%).

Over the past year, the percentage of millennials comparing prices and deals online has increased considerably, while the percentage of older generations doing so has remained largely unchanged. This is not particularly surprising, given millennials' familiarity with and use of technology. Millennials are also much more likely to have purchased used goods than are members of the other generations.
Millennials and older generations are equally likely (84%) to have purchased generic or store-brand goods. But while the percentage of millennials purchasing generic or store-brand goods increased over the past year, it declined by three percentage points among the older generations. Finally, older generations used coupons while shopping more often than millennials (60% vs. 55%) -- the only cost-saving method to show that pattern. Coupon use declined among all generations over the past year.
On the spending side of the ledger, millennials are more likely to engage in a number of less thrifty behaviors, suggesting they might be a little more freewheeling with their spending than are members of other generations. They are much more apt to have gone shopping for fun, to have made an impulse purchase and to have made a major purchase that cost at least one week's pay than are members of the other generations.
Impulse purchases and big-ticket purchases have notably increased among millennials -- but not among the other generations -- over the past year.
| Total across six polling periods | Change from one year ago | ||||||||||||||||||||||||||||||||||||||||||||||||||||||||||||||||||||||||||||||||||||||||||||||||||
|---|---|---|---|---|---|---|---|---|---|---|---|---|---|---|---|---|---|---|---|---|---|---|---|---|---|---|---|---|---|---|---|---|---|---|---|---|---|---|---|---|---|---|---|---|---|---|---|---|---|---|---|---|---|---|---|---|---|---|---|---|---|---|---|---|---|---|---|---|---|---|---|---|---|---|---|---|---|---|---|---|---|---|---|---|---|---|---|---|---|---|---|---|---|---|---|---|---|---|---|
| % | (pct. pts.) | ||||||||||||||||||||||||||||||||||||||||||||||||||||||||||||||||||||||||||||||||||||||||||||||||||
| GONE ONLINE TO COMPARE PRICES AND FIND THE BEST DEAL | |||||||||||||||||||||||||||||||||||||||||||||||||||||||||||||||||||||||||||||||||||||||||||||||||||
| Millennials | 71 | +9 | |||||||||||||||||||||||||||||||||||||||||||||||||||||||||||||||||||||||||||||||||||||||||||||||||
| Everyone else | 55 | +2 | |||||||||||||||||||||||||||||||||||||||||||||||||||||||||||||||||||||||||||||||||||||||||||||||||
| Generation gap (pct. pts.) | +16 | +7 | |||||||||||||||||||||||||||||||||||||||||||||||||||||||||||||||||||||||||||||||||||||||||||||||||
| PURCHASED USED GOODS | |||||||||||||||||||||||||||||||||||||||||||||||||||||||||||||||||||||||||||||||||||||||||||||||||||
| Millennials | 48 | -11 | |||||||||||||||||||||||||||||||||||||||||||||||||||||||||||||||||||||||||||||||||||||||||||||||||
| Everyone else | 34 | -- | |||||||||||||||||||||||||||||||||||||||||||||||||||||||||||||||||||||||||||||||||||||||||||||||||
| Generation gap (pct. pts.) | +14 | -11 | |||||||||||||||||||||||||||||||||||||||||||||||||||||||||||||||||||||||||||||||||||||||||||||||||
| MADE AN IMPULSE PURCHASE | |||||||||||||||||||||||||||||||||||||||||||||||||||||||||||||||||||||||||||||||||||||||||||||||||||
| Millennials | 47 | +18 | |||||||||||||||||||||||||||||||||||||||||||||||||||||||||||||||||||||||||||||||||||||||||||||||||
| Everyone else | 34 | +2 | |||||||||||||||||||||||||||||||||||||||||||||||||||||||||||||||||||||||||||||||||||||||||||||||||
| Generation gap (pct. pts.) | +13 | +16 | |||||||||||||||||||||||||||||||||||||||||||||||||||||||||||||||||||||||||||||||||||||||||||||||||
| GONE SHOPPING FOR FUN | |||||||||||||||||||||||||||||||||||||||||||||||||||||||||||||||||||||||||||||||||||||||||||||||||||
| Millennials | 39 | -1 | |||||||||||||||||||||||||||||||||||||||||||||||||||||||||||||||||||||||||||||||||||||||||||||||||
| Everyone else | 26 | +5 | |||||||||||||||||||||||||||||||||||||||||||||||||||||||||||||||||||||||||||||||||||||||||||||||||
| Generation gap (pct. pts.) | +13 | -6 | |||||||||||||||||||||||||||||||||||||||||||||||||||||||||||||||||||||||||||||||||||||||||||||||||
| MADE A MAJOR PURCHASE THAT COST AT LEAST ONE WEEK'S PAY | |||||||||||||||||||||||||||||||||||||||||||||||||||||||||||||||||||||||||||||||||||||||||||||||||||
| Millennials | 28 | +14 | |||||||||||||||||||||||||||||||||||||||||||||||||||||||||||||||||||||||||||||||||||||||||||||||||
| Everyone else | 21 | +3 | |||||||||||||||||||||||||||||||||||||||||||||||||||||||||||||||||||||||||||||||||||||||||||||||||
| Generation gap (pct. pts.) | +7 | +11 | |||||||||||||||||||||||||||||||||||||||||||||||||||||||||||||||||||||||||||||||||||||||||||||||||
| PURCHASED GENERIC OR STORE-BRAND GOODS | |||||||||||||||||||||||||||||||||||||||||||||||||||||||||||||||||||||||||||||||||||||||||||||||||||
| Millennials | 84 | +5 | |||||||||||||||||||||||||||||||||||||||||||||||||||||||||||||||||||||||||||||||||||||||||||||||||
| Everyone else | 84 | -3 | |||||||||||||||||||||||||||||||||||||||||||||||||||||||||||||||||||||||||||||||||||||||||||||||||
| Generation gap (pct. pts.) | -- | +8 | |||||||||||||||||||||||||||||||||||||||||||||||||||||||||||||||||||||||||||||||||||||||||||||||||
| USED COUPONS WHEN SHOPPING | |||||||||||||||||||||||||||||||||||||||||||||||||||||||||||||||||||||||||||||||||||||||||||||||||||
| Millennials | 55 | -8 | |||||||||||||||||||||||||||||||||||||||||||||||||||||||||||||||||||||||||||||||||||||||||||||||||
| Everyone else | 60 | -9 | |||||||||||||||||||||||||||||||||||||||||||||||||||||||||||||||||||||||||||||||||||||||||||||||||
| Generation gap (pct. pts.) | -5 | +1 | |||||||||||||||||||||||||||||||||||||||||||||||||||||||||||||||||||||||||||||||||||||||||||||||||
| Gallup | |||||||||||||||||||||||||||||||||||||||||||||||||||||||||||||||||||||||||||||||||||||||||||||||||||
Less Disciplined With Their Finances
These results, combined with the fact that 42% of millennials report having spent more this past year, suggest that some -- and in certain cases, most -- Americans are still actively finding ways to save money and reduce discretionary spending. However, millennials appear to go about the task differently than the older generations. They prioritize their spending differently and are less disciplined with their finances.
Download Gallup's latest report, How Millennials Want to Work and Live, to get further insight into Gallup's most important findings about millennials, including their demographic makeup, spending habits and desires for the workplace.


