This is the second article in a four-part series. Read the first, third and fourth articles.
The closer students get to graduating from high school and entering the world of work, the less enthusiastic they feel about school.
In fact, older students are engaged with school at much lower rates than younger students, according to the 2016 Gallup Student Poll survey of fifth- through 12th-grade students from about 3,000 schools that opted to participate in the survey.
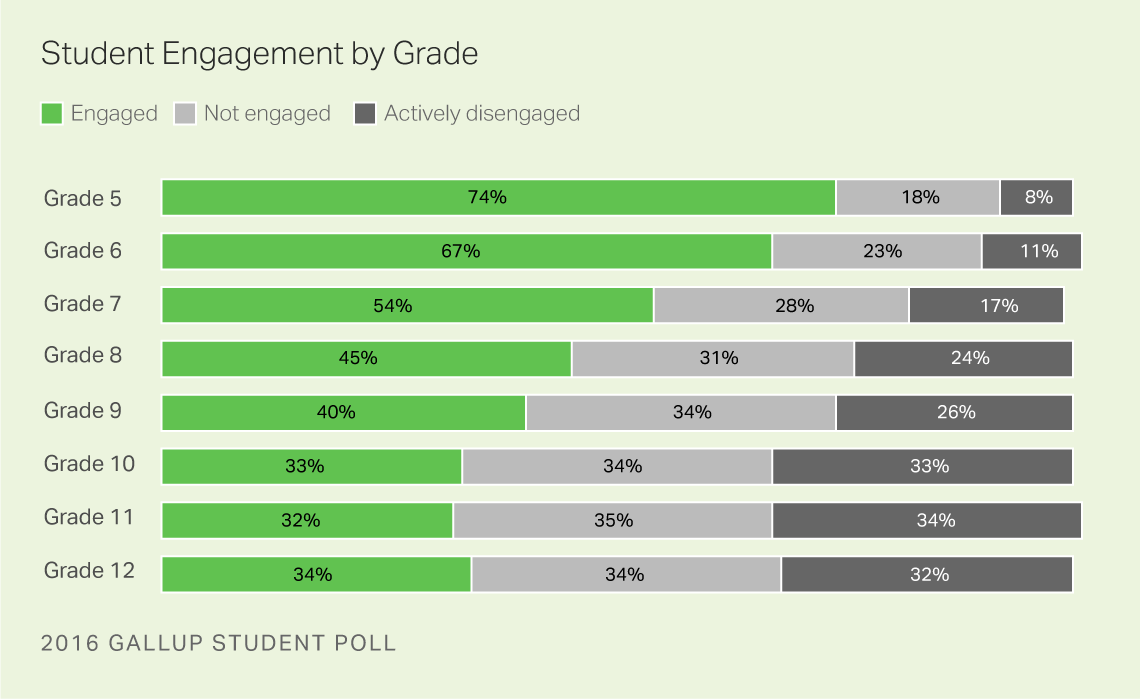
Of students surveyed, fifth-graders are most engaged, and 11th-graders are least engaged. The low engagement for older students relative to younger students should concern leaders, as education scholars have found that engagement is linked to students' success in school.
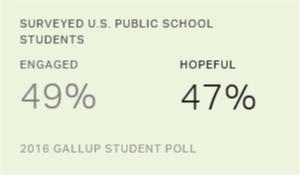
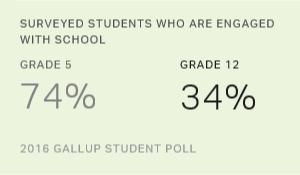
Gallup defines the engagement of students as students' involvement and enthusiasm with school. About half of U.S. public school students surveyed (49%) are engaged with school. Nearly three-quarters (74%) of all surveyed fifth-grade students are engaged, and only about one-third of surveyed students in 10th, 11th and 12th grades are engaged.
The "School Engagement Cliff"
The "school engagement cliff" poses a challenge for school leaders, with the starkest engagement differences occurring during the middle school years. There is a 13-percentage-point difference in engagement between sixth and seventh grade and a nine-point difference between seventh and eighth grade, with engagement declining as grade level for students increases.
These findings are from the 2016 Gallup Student Poll Snapshot Report and reflect results from the eighth annual Gallup Student Poll, which provides insights into how students experience their lives in and out of school. Gallup conducted the survey via the web Sept. 26-Oct. 28, 2016, and included about 3,000 public and private schools in the U.S. and Canada.
Nearly 5 million surveys have been completed by students from thousands of schools that opted to participate in the survey since Gallup launched the pilot in spring 2009.
The Gallup Student Poll includes four elements: engagement with school, hope for the future, entrepreneurial aspiration, and career and financial literacy.
Results of the 2016 Gallup Student Poll show that the surveyed fifth-grade students are over nine times more likely to be engaged with school than they are to be actively disengaged; however, the ratio of engaged to actively disengaged students shrinks dramatically for older students. Students surveyed in 10th, 11th or 12th grade are just as likely to be actively disengaged as they are to be engaged with school on Gallup's measure.
Outcomes for Actively Disengaged Students vs. Engaged Students
Findings from the 2016 Gallup Student Poll show that, compared with their actively disengaged peers, engaged students are:
- 4.5 times more likely to be hopeful for the future
- 2.5 times more likely to say they get excellent grades at school
- 2.5 times more likely to strongly agree they do well in school
On the other hand, compared with their engaged peers, actively disengaged students are:
- 9 times more likely to say they get poor grades at school
- 2 times more likely to say they missed a lot of school last year
- 7.2 times more likely to feel discouraged about the future
In addition to the relationship between engagement and desirable outcomes reported via the Gallup Student Poll survey, there is some indication that engagement is also linked with student achievement scores at the school level.
A Gallup study of 128 schools in Texas showed that student engagement is significantly related to students' academic growth and postsecondary readiness at the school level, based on the State of Texas Assessments of Academic Readiness outcomes. Namely, schools with higher engagement had higher percentages of students showing academic growth across subject areas, along with higher postsecondary readiness in math and writing. More research is needed to understand the extent to which engagement affects individual student growth.
The next article in this series has ideas for addressing the problem of the school engagement cliff.
Does your school know the best ways to measure and build engagement among students, staff and parents? Gallup can help you find out.
Survey Methods
The Gallup Student Poll results and findings are based on surveys collected via web from 909,617 students in grades five through 12, representing about 3,000 schools from 540 school districts across 49 states and the District of Columbia. Massachusetts was the only U.S. state not included in the poll. The online poll was completed by a convenience sample of schools and districts from Sept. 26-Oct. 28, 2016. Gallup does not randomly select schools participating in the annual Gallup Student Poll, nor does Gallup charge or provide any incentives for participation beyond school-specific data. Participation rates vary by school. The survey is anonymous and only group data are reported.
The annual Gallup Student Poll is offered at no cost for U.S. schools and districts. Gallup Student Poll data are not statistically weighted to account for nonresponse bias; therefore, the overall data from the annual administration of the Gallup Student Poll may not be generalizable to the U.S. student population of fifth- through 12th-grade students.
Mark Reckmeyer, Sr. Consultant, provided database management and analytics support for this article.