A new poll released by the Harvard University's Institute of Politics (IOP) reports an increase in support for the Republican Party by likely millennial voters. The report concludes that among 18- to 29-year-olds who are likely voters -- those who say they will "definitely be voting" in November - 51% say they prefer a Republican controlled Congress, while 47% prefer a Democratic Congress. The report says that in September 2010, 43% of likely voters aged 18-29 preferred a Republican Congress and 55% a Democratic Congress. This represents a shift from a +12 to a -4 percentage point Democratic advantage among young likely voters on this question over four years. That's a big shift, and certainly not one mirrored by the overall national generic ballot among all likely voters as reported by various organizations -- if anything, intended congressional voting among likely voters has become somewhat less Republican in orientation this year compared with the 2010 election.
The IOP report says that 26% of the 2,029 18- to 29-year-olds interviewed in their sample were likely voters -- or about 525 people. The interviewing was conducted using the KnowledgePanel system which recruits individuals randomly to join an ongoing survey panel.
IOP's report notes that, despite the preferences of their likely voter group, their larger sample of all 18- to 29-year-olds has a preference for Democratic over Republican control of Congress, 50% to 43%. A look back at their 2010 report shows that among all 18- to 29-year-olds that year, preference for Democratic over Republican control of Congress was 53% to 42%. So, among the overall sample of 18- to 29-year-olds, the Democratic advantage has gone from +11 to +7, a modest drop of four points. And, again, the Democratic advantage among 18- to 29-year-old likely voters in their two samples has gone from +12 to -4, or a shift of 16 points. So the swing among likely voters in their sample is much higher than the swing among all 18- to 29-year-olds.
Sample statistics calculated from likely voters with smaller samples, as in the case of the IOP research, can exhibit much more fluctuation than trends among overall samples, based on the larger general margin of error associated with small samples, and also with the shifting impact of likely voter screens from survey to survey. That could account for some of the much higher shift in political orientation among young likely voters than among all young voters.
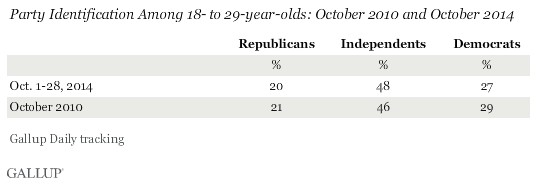
At this point, I can note that our Gallup data among all 18- to 29-year-olds, like the IOP data for their broad sample, show little change in political orientation over the past four years. We can look at party identification using our very large samples from Gallup Daily tracking in October 2010 and October 2014. Party identification is not the same as the results of a question asking about desired control of Congress, but the party identification trend among all 18- to 29-year-olds certainly gives us a good feel for the political trends among this group.
As noted, the data show not much change at all in political identification among 18- to 29-year-olds over the past four years. The younger group of Americans are about as Democratic now as they were in 2010.

Young adults in both 2010 and 2014 were most likely to identify as independents, with an edge for the Democratic Party among those who do identify with a party. That Democratic edge is +7 now (in October 2014), and was +8 back in 2010. In other words, very little evidence here of a young American shift toward the Republican Party. Instead, the data provide a picture of a very stable Democratic edge among 18- to 29-year-olds in 2010 and in 2014. As noted, the IOP data also show a stable Democratic edge among their overall sample as well, using the control of Congress question.
The stability in Gallup's large sample trends in overall party identification among 18- to 29-year-olds -- and IOP's generally stable trends in their control of Congress question among all 18- to 29-year-olds -- certainly suggest caution in making any sweeping conclusions about young people abandoning their traditionally more Democratic orientation.
The IOP report also notes, "President [Barack] Obama's job performance among America's 18- to 29-year-olds has fallen from 47% (April 2014) to 43% (53%: disapprove), the second-lowest rating in the IOP polls since he took office (41%: November 2013)." We can check that against our data pretty easily. And we do find a slight tendency for young Americans to have disproportionately dropped their approval of President Obama over time.
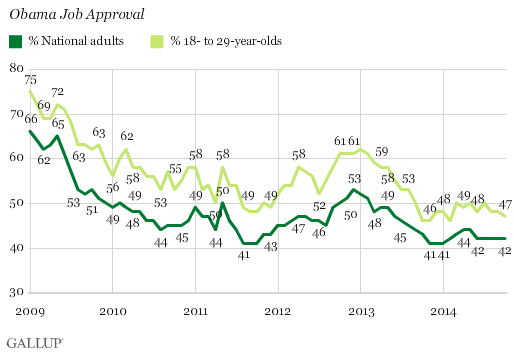
Gallup shows a higher job approval rating for Obama among 18- to 29-year-olds than the IOP in general. Obama job approval is 47% among 18- to 29-year-olds in our Gallup Daily tracking so far in October. That compares with the IOP approval rating of 43% in their latest poll. In October of 2010, Gallup showed 18- to 29-year-olds' approval of Obama was at 53%. And that compares with 47% in the 2010 IOP sample. So, there has been a drop in approval in both -- a drop of six points in the Gallup data and a drop of four points in the IOP data, even though Gallup registers a higher approval rating for Obama overall.
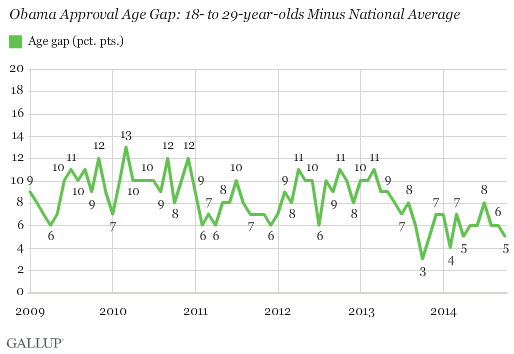
More generally, it is important to look a little more closely at the differential between young people and the national average. The absolute change in a president's job approval rating is much better understood if it is measured in the context of the overall trends. As I explained here, a drop in a subgroup is much less meaningful if a corresponding drop is seen in the overall population.
The two graphs below allow us to make that comparison. The average difference in job approval ratings between 18- to 29-year-olds and the overall national population is 8.3 percentage points since Obama took office. But the "youth gap" has been lower than the 8.3-point average in every poll conducted since June 2013. Thus, these data confirm that Obama has been losing some support on a relative basis among 18- to 29-year-olds over the last year or so. This contrasts with the situation for women and blacks, among whom the president's support has remained remarkably constant on a relative basis.


One final point. The IOP defines millennial voters as 18 to 29 years old, although some definitions say millennials are those who reached adulthood (or 18 years) in 2000, which would make them today those born from 1982 up to 1996 (the latest year of birth to make an 18-year-old cutoff today), or in other words, those who are today 18 to 32 years. But 18-29 is a convenient age group and one that we use ourselves very frequently here at Gallup.

