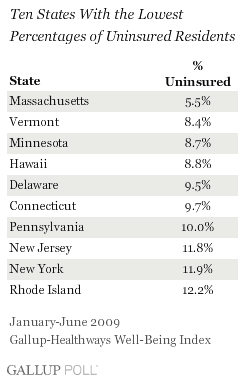
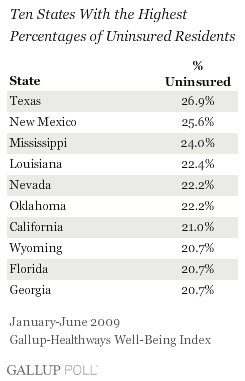
WASHINGTON, D.C. -- Higher percentages of Texas, New Mexico, and Mississippi residents are without health insurance -- roughly one in four -- than is true for any other states in the U.S. In Massachusetts, where legislation requires all residents to carry health insurance coverage or face a tax penalty, 5.5% are without insurance -- the lowest percentage in the country.


These results are based on more than 178,000 interviews conducted from January-June 2009 as part of the Gallup-Healthways Well-Being Index. In each daily survey of 1,000 Americans aged 18 and older, Gallup asks respondents whether they have health insurance. Based on these data, Gallup previously reported an increase in the number of uninsured adults nationwide from 14.8% in 2008 to 16.2% in 2009. Now, Gallup's examination of state-level data reveals that so far in 2009, the percentage of uninsured adults in every state has either increased or remained statistically unchanged from 2008. The greatest increases in the percentage of uninsured have been in Nebraska, New Mexico, and Utah.

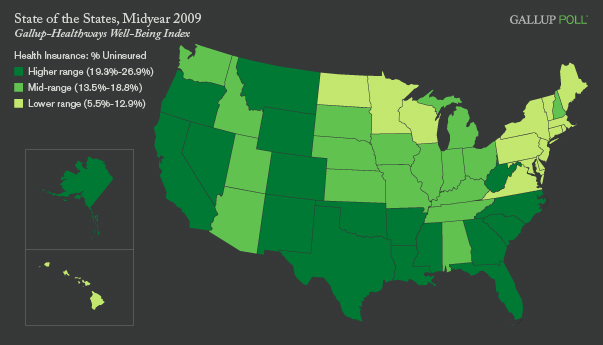
The accompanying map depicts the geographical breakdown of the percentage of uninsured adults by state. States with comparatively lower uninsured populations are located primarily in the Northeast. Those with relatively higher percentages of uninsured are spread across the South and West. Given that Gallup has previously found that a disproportionate percentage of Hispanics are uninsured at the national level, it is worth noting that a number of states with the highest percentages of uninsured are also states with large percentages of Hispanic residents.

Bottom Line
President Obama and congressional leaders are working tirelessly to solidify a healthcare reform bill, with one key goal being the expansion of coverage to the uninsured. Gallup data showing that 5.5% of adults in Massachusetts are uninsured three years after the passage of healthcare reform legislation there underscores the difficulty of achieving universal coverage. Nationwide, the percentage of uninsured adults has increased or remained stable in the first six months of 2009 compared to 2008, suggesting that unless changes are made to the current system, whether or not those come from the federal government, a sizable proportion of the population would continue to go without coverage.
Gallup.com's "State of the States" series reveals state-by-state differences on political, economic, and wellbeing measures Gallup tracks each day, based on data collected between January and June 2009. To see all stories published in the midyear 2009 series, click here. New stories will be released throughout the month of August.
Survey Methods
Results are based on telephone interviews with 178,545 national adults, aged 18 and older, conducted Jan. 2-June 30, 2009, as part of the Gallup-Healthways Well-Being Index. For results based on the total sample of national adults, one can say with 95% confidence that the maximum margin of sampling error is ±0.2 percentage points.
The margin of sampling error for most states is ±1-2 percentage points, but is as high as ±4 percentage points for smaller states such as Wyoming, North Dakota, South Dakota, Delaware and Hawaii.
Interviews are conducted with respondents on land-line telephones (for respondents with a land-line telephone) and cellular phones (for respondents who are cell-phone only).
In addition to sampling error, question wording and practical difficulties in conducting surveys can introduce error or bias into the findings of public opinion polls.
About the Gallup-Healthways Well-Being Index™
The Gallup-Healthways Well-Being Index is the first and largest survey of its kind, with 1,000 calls a day, seven days a week. It is the official statistic for Wellbeing in America, giving a daily measure of people's wellbeing at the close of every day based on the World Health Organization (WHO) definition of health as not only the absence of infirmity and disease but also a state of physical, mental and social wellbeing. The Well-Being Index will be a daily measure determining the correlation between the places where people work and the communities in which they live, and how that and other factors impact their wellbeing. Additionally, The Well-Being Index will increase the understanding of how those factors impact the financial health of corporations and communities. For additional information, go to www.well-beingindex.com.
