PRINCETON, NJ -- Republicans and Democrats are now tied at 45% in registered voters' preferences for which party's congressional candidate they would support "if the elections for Congress were being held today." Since last fall, the two major parties have been closely matched on this important gauge of the 2010 midterm elections, with neither achieving more than a four percentage-point lead. In mid-2009, the Democrats led by six points.
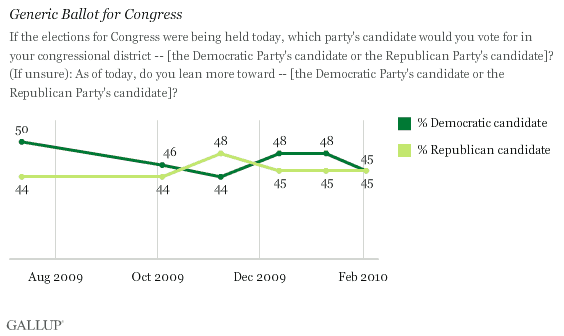
The closeness of the two parties over the past several months on this "generic ballot" measure is similar to that found in most Gallup readings from 1994 through 2005 (spanning the period when Republicans won control of the U.S. House and subsequently maintained it for more than a decade).
"While voter enthusiasm today is fairly high, overall, more than half of Republicans (including independents who lean Republican) say they are 'more enthusiastic' about voting, compared with 41% of Democrats/Democratic leaners."
Closer to elections, Gallup bases its generic-ballot results on voters deemed most likely to vote. Because Republicans are generally more likely than Democrats to turn out to vote, particularly in midterm elections, their positioning improves by several points when the generic ballot is based on likely voters rather than registered voters. Thus, a tie between Democrats and Republicans among registered voters probably corresponds to a Republican lead among likely voters.
Independents Currently in GOP Corner
While Democrats outnumber Republicans nationwide among registered voters, it is independents' preference for Republicans, 47% to 31%, that is responsible for the tie between the parties. However, a sizable 22% of independents are unsure or plan to vote for neither party -- highlighting the potential for volatility in voter preferences in the months ahead. At the same time, the vast majority of Republicans and Democrats plan to vote for their own party's candidate.
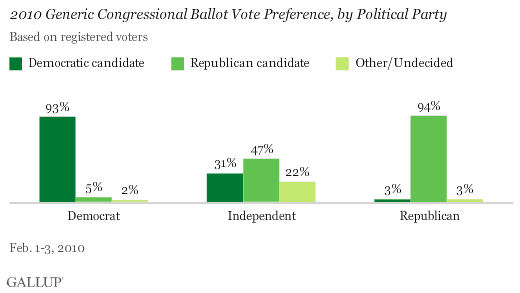
Republicans have tied or led Democrats among independents in every Gallup generic ballot measure for the 2010 midterms, starting with the initial measurement in July 2009. Although independents' support for Democratic candidates slipped six percentage points in the past month (from 37% to 31%), the percentage favoring the Republican candidate also fell slightly, while the percentage undecided about their 2010 vote rose to 22%, the highest to date.
The congressional voting preferences of independents leading up to the 2010 midterms have thus far been markedly different from independents' preferences prior to the 2006 elections -- highlighting the changed political climate this year. In 2006 polling from January through early November, Gallup found independents consistently favoring the Democrats, in some cases by substantial margins. That year the Democrats recaptured control of the U.S. House, gaining 30 seats. (Independents also tended to prefer Democratic congressional candidates in 2008, a year when the Democrats expanded their majority status.)
Voter Enthusiasm Apparent Early This Election Year
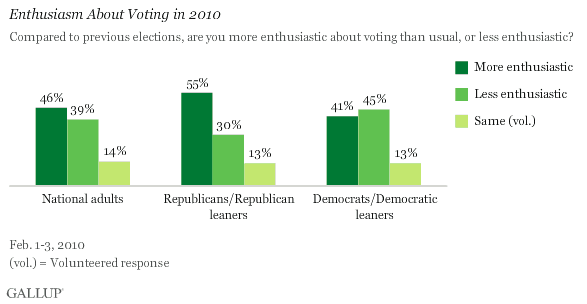
Nearly half of all national adults today (46%) say that, compared to previous elections, they are "more enthusiastic" about voting. Another 39% are less enthusiastic, while 14% volunteer that they feel the same. The percentage more enthusiastic is similar to the levels seen through most of the 2006 midterm election year. However, it is higher than what Gallup found in 1994 and 1998, even right before those years' elections.
While voter enthusiasm today is fairly high, overall, more than half of Republicans (including independents who lean Republican) say they are "more enthusiastic" about voting, compared with 41% of Democrats/Democratic leaners.
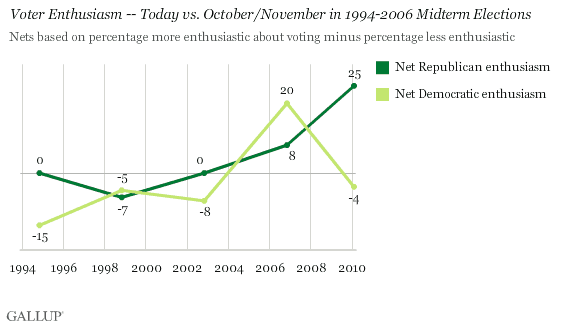
The resulting levels of "net enthusiasm" are +25 for Republicans (55% more enthusiastic minus 30% less enthusiastic) and -4 for Democrats. This is a reversal from 2006, when Democrats were more enthusiastic than Republicans, and represents the widest enthusiasm gap seen for any midterm election since 1994. Differences in net enthusiasm between the parties usually indicate a stronger performance at the polls for the party with the advantage.
Bottom Line
As of now, Republicans are positioned to do well in the November congressional elections. Not only are registered voters evenly split in their preferences for Republican and Democratic candidates -- an indication that Republicans would lead Democrats among likely voters if the elections were held today -- but Republican voters are far more enthusiastic about voting this year than are Democrats.
Survey Methods
Results are based on telephone interviews with 1,025 national adults, aged 18 and older, conducted Feb. 1-3, 2010. For results based on the total sample of national adults, one can say with 95% confidence that the maximum margin of sampling error is ±4 percentage points.
Interviews are conducted with respondents on land-line telephones (for respondents with a land-line telephone) and cellular phones (for respondents who are cell-phone only).
In addition to sampling error, question wording and practical difficulties in conducting surveys can introduce error or bias into the findings of public opinion polls.
