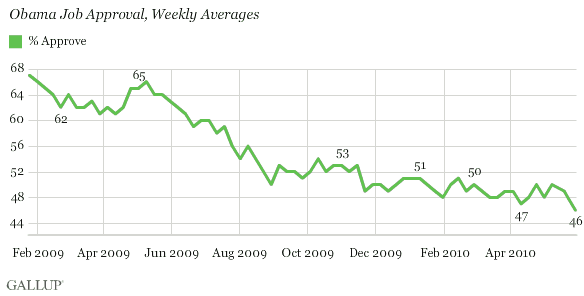
PRINCETON, NJ -- At 46%, President Obama's job approval average for the week ending May 30 is the lowest weekly average of his administration, one point below the previous low of 47% measured in April.

Overall, Obama's weekly job approval average has generally been quite stable in 2010 so far, and has been at or below 50% since mid-February. It fell out of the 60% range in early summer 2009 and first fell below 50% in late November.
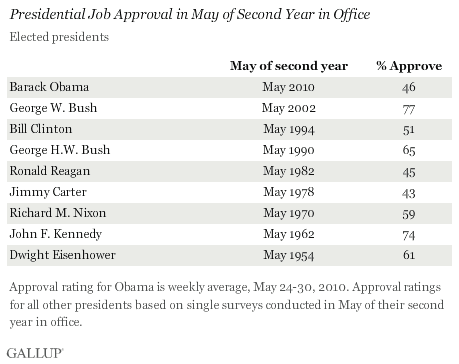
Obama Rating Lower Than Most Presidents' Comparables
Obama's end-of-May weekly average is lower than the single-survey ratings for all but two of the nine elected presidents since Eisenhower during May of those presidents' second years in office. Ronald Reagan's approval rating in a May 1982 survey was 45%, one point below Obama's current rating, and Jimmy Carter was at 43% in May 1978. George W. Bush's 77% was the highest such reading, reflecting the continuing rally effect that followed the Sept. 11, 2001, terrorist attacks.

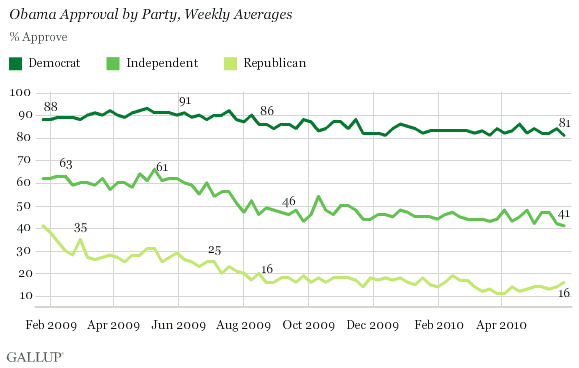
Approval Among Independents Reaches New Low
Obama's current 41% weekly approval rating among independents is by one point the lowest of his administration. His 81% rating among Democrats is tied for the lowest so far among that group, while his current 16% among Republicans is actually up slightly from recent weeks.

The current 65-point "polarization gap" between Democrats and Republicans in their approval of Obama is slightly smaller than the average 69-point gap so far this year.

Solid Support Among Blacks; Steady Among Whites
Obama's weekly average among blacks remains very high, at 93%, while his 39% approval rating among non-Hispanic whites is roughly where it has been since March. There is evidence that Obama's approval rating among Hispanics has been slipping; Gallup will analyze his standing among Hispanics in detail (based on larger sample aggregations) in a forthcoming report on Gallup.com.

Bottom Line
President Obama's weekly job approval averages have generally been quite stable this year, with a range extending between 46% and 51% since January. At the same time, these readings represent a significant drop-off in approval compared with the 60%+ ratings he had for the first five months of his administration and his overall average of 57% in 2009.
Obama's current 46% weekly average is slightly below where it has been recently. It can be difficult to identify precisely what causes ups and downs in a president's approval rating. There was a great deal of news focus on the BP oil spill last week, and, although it may be tempting to say the spill is affecting Obama's ratings, it is impossible to say this with certainty.
Last week was also a down week for Democrats in terms of their relative positioning on Gallup's generic ballot. It will be important to monitor both the generic ballot and Obama's approval rating in the weeks ahead to see whether last week represented a short-lived drop in Democrats' fortunes, or the beginning of a trend that could carry forward into the intensive fall election season.
Explore President Obama's approval ratings in-depth and compare to past presidents in the Gallup Presidential Job Approval Center.
Survey Methods
Results are based on telephone interviews conducted May 24-30, 2010, with a random sample of 3,591 national adults, aged 18 and older, living in all 50 U.S. states and the District of Columbia, selected using a random-digit-dial sampling technique.
For results based on the total sample of national adults, one can say with 95% confidence that the maximum margin of error is ±2 percentage points.
Interviews are conducted with respondents on landline telephones and cellular phones, with interviews conducted in Spanish for respondents who are primarily Spanish-speaking. Each sample includes a minimum quota of 150 cell phone respondents and 850 landline respondents, with additional minimum quotas among landline respondents for gender within region. Landline respondents are chosen at random within each household on the basis of which member had the most recent birthday.
Samples are weighted on the basis of gender, age, race, Hispanic ethnicity, education, region, adults in the household, cell phone only status, cell phone mostly status and phone lines. Demographic weighting targets are based on the March 2009 Current Population Survey figures for the aged 18 and older non-institutionalized population living in U.S. telephone households. All reported margins of sampling error include the computed design effects for weighting and sample design.
In addition to sampling error, question wording and practical difficulties in conducting surveys can introduce error or bias into the findings of public opinion polls.
