PRINCETON, NJ -- Americans' economic optimism declined from 41% at the beginning of May to 30% in mid-July before ticking up to 33% over the past couple of weeks.
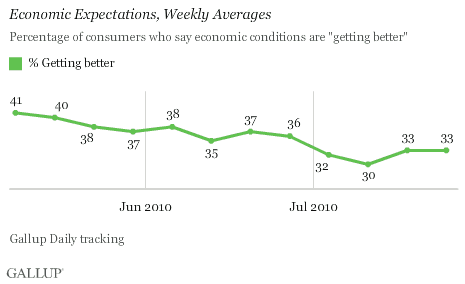
This trend suggests that Friday's Reuters/University of Michigan Consumer Sentiment Index should decline compared with June -- but at the same time, it may be slightly better than its early July preliminary estimate. However, that degree of precision is far from certain, given the index's relatively small sample size.
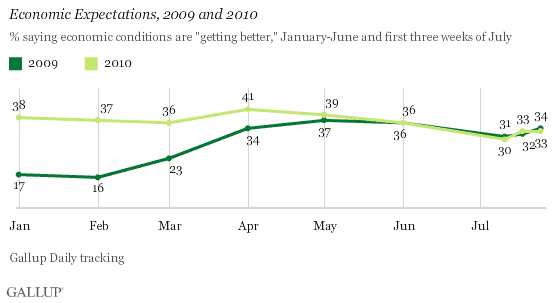
Optimism Similar to a Year Ago
Weekly trends in economic optimism that Gallup has measured over the past three months are surprisingly similar to those of a year ago. That is, consumers are no more optimistic now about the future course of the economy than they were when the economy was just beginning to recover from its late 2008 and early 2009 plunge and as companies were aggressively shedding jobs.
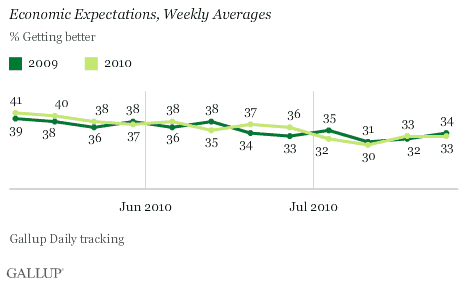
A slightly longer view shows the difference in year-over-year consumer expectations: 38% of Americans in January 2010 said the economy was "getting better," compared with 17% in January 2009, for a difference of 21 percentage points. This year-over-year difference fell to zero in June 2010 and has been essentially maintained during three weeks of July.
Bottom Line
The Conference Board on Tuesday reported a decline in consumer confidence in July, something Gallup has been reporting for weeks. Reuters/University of Michigan also reported a sharp decline in consumer sentiment in its preliminary report for July. While these monthly measures are belatedly catching up with the Gallup weekly trend, they have not reflected the steady erosion in consumer expectations over the past 12 weeks, or the uptick of the past two weeks that most likely came in response to the surge on Wall Street.
The most troubling finding in the Gallup data, however, is that today's consumer expectations are no better than those of a year ago. Americans' views may reflect the prospect of a jobless recovery; the unemployment rate is expected to remain near double digits for the rest of the year. American consumers might also be taking to heart Federal Reserve Chairman Ben Bernanke's assertion that this is a period of "unusual uncertainty" as something that applies to them just as much as businesses and policymakers.
With expectations no more hopeful than they were 12 months ago, it is not surprising that the economic stimulus plan's opponents argue that it has not worked. At the same time, proponents maintain that the stimulus was not big enough and that more is needed. Regardless, something more than a Wall Street surge needs to be done to arrest the continuing slump of consumer expectations and ensure that any 2010 second-half slowdown remains no worse than a "soft patch."
Gallup.com reports results from these indexes in daily, weekly, and monthly averages and in Gallup.com stories. Complete trend data are always available to view and export in the following charts:
Daily: Employment, Economic Confidence and Job Creation, Consumer Spending
Weekly: Employment, Economic Confidence, Job Creation, Consumer Spending
Read more about Gallup's economic measures.
For Gallup Daily tracking, Gallup interviews approximately 1,000 national adults, aged 18 and older, each day. The Gallup economic confidence results are based on random half-samples of approximately 500 national adults, aged 18 and older, each day. Weekly results are based on telephone interviews with approximately 3,000 adults.
For these results, one can say with 95% confidence that the maximum margin of sampling error is ±3 percentage points.
Interviews are conducted with respondents on landline telephones and cellular phones, with interviews conducted in Spanish for respondents who are primarily Spanish-speaking. Each daily sample includes a minimum quota of 150 cell phone respondents and 850 landline respondents, with additional minimum quotas among landline respondents for gender within region. Landline respondents are chosen at random within each household on the basis of which member had the most recent birthday.
Samples are weighted by gender, age, race, Hispanic ethnicity, education, region, adults in the household, cell phone-only status, cell phone-mostly status, and phone lines. Demographic weighting targets are based on the March 2009 Current Population Survey figures for the aged 18 and older non-institutionalized population living in U.S. telephone households. All reported margins of sampling error include the computed design effects for weighting and sample design.
In addition to sampling error, question wording and practical difficulties in conducting surveys can introduce error or bias into the findings of public opinion polls.
For more details on Gallup's polling methodology, visit https://www.gallup.com/.