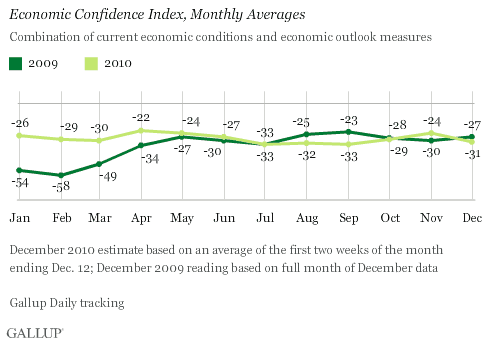
PRINCETON, NJ -- Economic confidence is deteriorating sharply at the worst possible time for the nation's retailers. Gallup's Economic Confidence Index averaged −31 over the first two weeks of December -- fully offsetting November's improvement, and essentially matching the monthly readings of −29 in October and −33 in September.

Consumers are no more optimistic about the U.S. economy in early December 2010 than they were at this time a year ago.
The Economic Confidence Index consists of two sets of ratings: one involving U.S. consumers' perceptions of current economic conditions and the other involving their economic outlook. The December estimate is based on more than 5,000 interviews conducted during the two weeks ending Dec. 12, 2010.
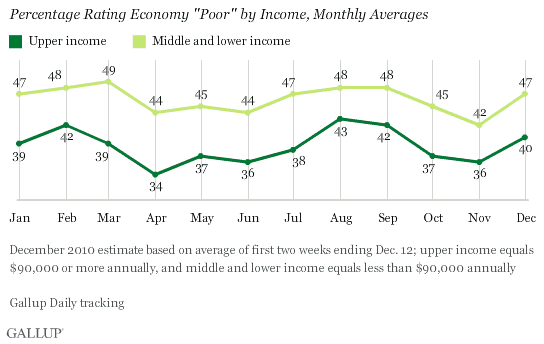
Percentage Rating the Economy "Poor" Worsens Across Income Groups
During the first two weeks of December, 45% of Americans rated current economic conditions "poor" -- wiping out the improvement to 41% in November, and essentially matching the 44% of October. Consumers' ratings of current economic conditions deteriorated about equally among upper-income consumers (those making $90,000 or more a year) as well as middle- and lower-income Americans (those making less than $90,000).

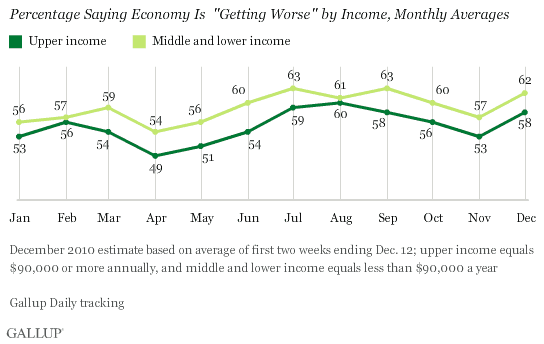
Americans of All Incomes Less Optimistic About Economy's Direction
Right now, consumers' expectations for the economy are substantially worse across income groups than they were during November, with 61% now saying the economy is getting worse. During the first two weeks of December, 58% of upper-income Americans and 62% of middle- and lower-income consumers said economic conditions are "getting worse" -- a worsening from 53% and 57%, respectively, in November.

Americans' Economic Optimism Fading in Early December
Gallup's Economic Confidence Index suggests that the sharp improvement in economic confidence seen in November may be dissipating at the worst possible time for the nation's retailers. The sour reactions of many to the Federal Reserve's efforts to pour money into the economy -- so-called quantitative easing -- may have negatively affected the economic outlook of some consumers and investors. That might also be the case with the financial difficulties in Europe. If so, the statement of the Federal Open Market Committee on Tuesday afternoon, and the reaction to it, could be more important than usual.
More likely, the government's early December report of a surprisingly high unemployment rate for November may have increased consumer worries not only about jobs but also the direction of the U.S. economy. This despite Gallup's tracking data suggesting this government report may be overstated -- at least as far as what is really taking place in the job market right now.
It also might be the case that some Americans who had hoped for increased political harmony after the midterm elections are disappointed about the current battle over the proposed extension of the Bush tax cuts and the extension of emergency unemployment insurance, particularly when so many Americans tend to support both efforts.
Regardless, consumer spending does not reflect an improving economy at this point. Add in the recent decline in economic confidence, and Christmas sales may not meet the increasing expectations that followed the success of Black Friday week.
Gallup will publish its final estimate of Christmas spending later this week.
Gallup.com reports results from these indexes in daily, weekly, and monthly averages and in Gallup.com stories. Complete trend data are always available to view and export in the following charts:
Daily: Employment, Economic Confidence and Job Creation, Consumer Spending
Weekly: Employment, Economic Confidence, Job Creation, Consumer Spending
Read more about Gallup's economic measures.
View our economic release schedule.Survey Methods
Results are based on telephone interviews conducted as part of Gallup Daily tracking during the first two weeks of December ending Dec. 12, 2010, with a weekly random sample of 3,000 adults, aged 18 and older, living in all 50 U.S. states and the District of Columbia, selected using random-digit-dial sampling.
For results based on the total weekly sample of national adults, one can say with 95% confidence that the maximum margin of sampling error is ±3 percentage points. For results based on the total monthly sample of more than 15,000 national adults, one can say with 95% confidence that the maximum margin of sampling error is ±1 percentage point.
Interviews are conducted with respondents on landline telephones (for respondents with a landline telephone) and cellular phones (for respondents who are cell phone-only). Each sample includes a minimum quota of 150 cell phone-only respondents and 850 landline respondents, with additional minimum quotas among landline respondents for gender within region. Landline respondents are chosen at random within each household on the basis of which member had the most recent birthday.
Samples are weighted by gender, age, race, education, region, and phone lines. Demographic weighting targets are based on the March 2009 Current Population Survey figures for the aged 18 and older non-institutionalized population living in continental U.S. telephone households. All reported margins of sampling error include the computed design effects for weighting and sample design.
In addition to sampling error, question wording and practical difficulties in conducting surveys can introduce error or bias into the findings of public opinion polls.
For more details on Gallup's polling methodology, visit www.gallup.com.
