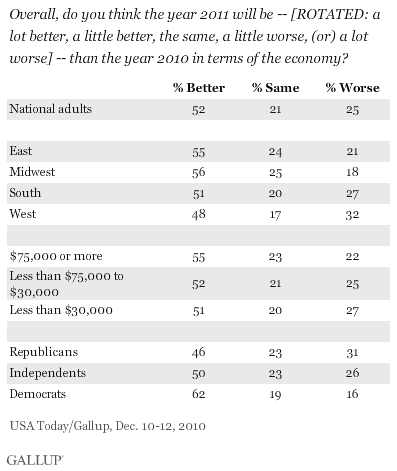
PRINCETON, NJ -- Twice as many Americans think the U.S. economy will be better rather than worse in 2011.
Americans living in the East and Midwest are a little more optimistic about the economic outlook for 2011 than those living in the South and West. Americans making $75,000 or more in annual income are slightly more optimistic than other Americans, and Democrats are considerably more optimistic than their independent and Republican counterparts.

Americans Report More Modest Differences in Their Personal Financial Situations
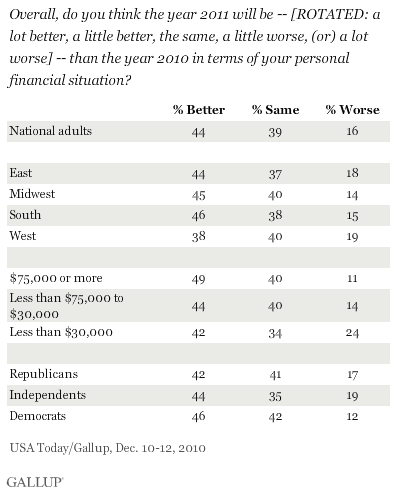
Americans are somewhat less positive about their personal economic situations than the economy more broadly. Forty-four percent think their personal situation will be better in 2011, while 16% think it will be worse. Fewer Americans in the West are optimistic about their personal situations than in other regions. Americans making $75,000 or more in annual income are more optimistic than other Americans, and Democrats are slightly more optimistic than independents and Republicans.

Americans' optimism about the economy parallels their generally optimistic expectations for 2011. This tends to be the case across regions, incomes, and party affiliation.
This overall increase in optimism was in place prior to the passage of new legislation at the end of the lame-duck Congress and the surge in spending at the end of the Christmas holiday. Recent Gallup Daily tracking results show that consumers only became increasingly optimistic about the economy as 2010 came to an end.
On the other hand, the potential fragility surrounding Americans' optimism as they look toward 2011 is reflected by consumers' view of their own financial situations. Americans express less optimism about their own situations, and this reveals more modest differences across regions, incomes, and party affiliation. This may result from Americans being closer to their own financial situations and recognizing the relative stability of those situations. In turn, it also suggests that at least some part of Americans' optimism about 2011 is based on their general perceptions of the overall economic climate rather than their own experiences and expectations about their personal financial situations.
Gallup.com reports results from these indexes in daily, weekly, and monthly averages and in Gallup.com stories. Complete trend data are always available to view and export in the following charts:
Daily: Employment, Economic Confidence and Job Creation, Consumer Spending
Weekly: Employment, Economic Confidence, Job Creation, Consumer Spending
Read more about Gallup's economic measures.
View our economic release schedule.
Results for this USA Today/Gallup poll are based on telephone interviews conducted Dec. 10-12, 2010, with a random sample of 1,019 adults, aged 18 and older, living in the continental U.S., selected using random-digit-dial sampling.
For results based on the total sample of national adults, one can say with 95% confidence that the maximum margin of sampling error is ±4 percentage points.
Interviews are conducted with respondents on landline telephones (for respondents with a landline telephone) and cellular phones (for respondents who are cell phone-only). Each sample includes a minimum quota of 150 cell phone-only respondents and 850 landline respondents, with additional minimum quotas among landline respondents for gender within region. Landline respondents are chosen at random within each household on the basis of which member had the most recent birthday.
Samples are weighted by gender, age, race, education, region, and phone lines. Demographic weighting targets are based on the March 2009 Current Population Survey figures for the aged 18 and older non-institutionalized population living in continental U.S. telephone households. All reported margins of sampling error include the computed design effects for weighting and sample design.
In addition to sampling error, question wording and practical difficulties in conducting surveys can introduce error or bias into the findings of public opinion polls.
View methodology, full question results, and trend data.
For more details on Gallup's polling methodology, visit https://www.gallup.com/.
