PRINCETON, NJ -- Gallup's Economic Confidence Index hit -31 in the week ending March 20 -- its worst weekly level of 2011 and matching the comparable week a year ago.

Gallup's Economic Confidence Index consists of two measures: one evaluating Americans' expectations about the future direction of the economy -- the percentage "getting better" or "getting worse" -- and the other gauging consumers' perceptions of current economic conditions.
Americans Rate Economy Slightly Better Than a Year Ago
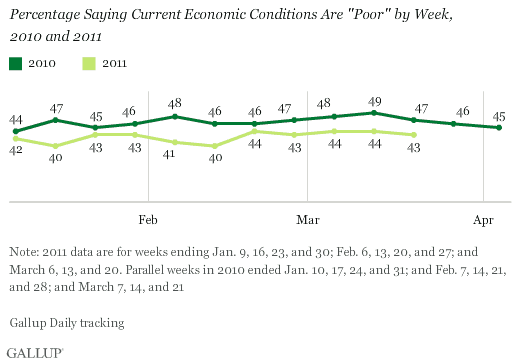
Forty-three percent of Americans rated current economic conditions "poor" during the week ending March 20 -- essentially the same as their ratings during the past month. Americans' ratings of the current economy continue to show some improvement compared with the mid- to upper 40% readings of the same weeks a year ago.

Americans' Economic Expectations Not as Good as a Year Ago
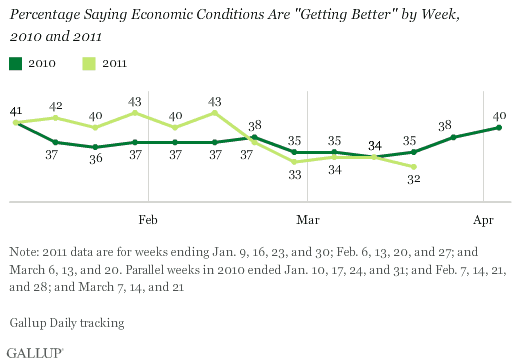
Thirty-two percent of Americans said the economy is "getting better" during the week ending March 20, a slight decline from the 34% of the prior two weeks. Fewer Americans currently feel the economy is improving than held that expectation a year ago, when 35% said things were getting better. Americans were more optimistic about the economic outlook in the earlier part of 2011 than they are now.

Implications
Americans have been bombarded by new worries in recent days with the war in Libya, unrest in much of the Middle East, and the seemingly endless series of catastrophes in Japan. Add in the weak jobs situation, high gas and food prices, the volatility on Wall Street, and the continuing budget battles in Washington, D.C., and it is not surprising that economic confidence is at its low point for 2011.
A year ago, consumer optimism strengthened in April. Spending followed suit as "frugality fatigue" began to take hold. In May, the financial crisis in Europe seemed to take the steam out of last year's improving momentum, both in confidence and, later, in spending.
The question is whether today's global and domestic economic challenges have already done the same to the optimism of early 2011. Gallup Daily tracking will continue to measure whether this is the case or whether the current results reflect anxieties that are more short-term in nature.
Gallup.com reports results from these indexes in daily, weekly, and monthly averages and in Gallup.com stories. Complete trend data are always available to view and export in the following charts:
Daily: Employment, Economic Confidence and Job Creation, Consumer Spending
Weekly: Employment, Economic Confidence, Job Creation, Consumer Spending
Read more about Gallup's economic measures.
View our economic release schedule.
Survey Methods
Results are based on telephone interviews conducted with 3,513 respondents, aged 18 and older, living in all 50 U.S. states and the District of Columbia, as part of Gallup Daily tracking March 14-20, 2011, selected using random-digit-dial sampling.
For results based on the total weekly sample of national adults, one can say with 95% confidence that the maximum margin of sampling error is ±3 percentage points.
Interviews are conducted with respondents on landline telephones and cellular phones, with interviews conducted in Spanish for respondents who are primarily Spanish-speaking. Each daily sample includes a minimum quota of 200 cell phone respondents and 800 landline respondents, with additional minimum quotas among landline respondents for gender within region. Landline respondents are chosen at random within each household on the basis of which member had the most recent birthday.
Samples are weighted by gender, age, race, Hispanic ethnicity, education, region, adults in the household, cell phone-only status, cell phone-mostly status, and phone lines. Demographic weighting targets are based on the March 2010 Current Population Survey figures for the aged 18 and older non-institutionalized population living in U.S. telephone households. All reported margins of sampling error include the computed design effects for weighting and sample design.
In addition to sampling error, question wording and practical difficulties in conducting surveys can introduce error or bias into the findings of public opinion polls.
For more details on Gallup's polling methodology, visit www.gallup.com.
