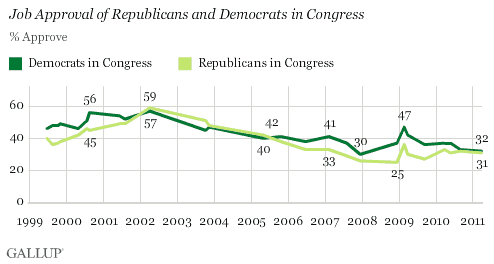
PRINCETON, NJ -- As Congress attempts to come up with a budget agreement to avoid a government shutdown, Americans' views of both parties in Congress are equally negative -- 31% approve of the Republicans in Congress and 32% approve of the Democrats in Congress. Each party's rating is among the lowest Gallup has found since the question was first asked in 1999.

Democrats' 32% approval rating in the March 25-27 Gallup poll is just two percentage points above its low point, registered in December 2007. Republicans' current rating is six points better than its low of 25% in December 2008.
Americans generally look less favorably on Congress as an institution than they do on the presidency or Supreme Court. Thus, it has been rare for a majority of Americans to approve of how the Congress, and how either party in Congress, is doing. In fact, neither party has achieved this distinction in nearly eight years.
Republicans in Congress last earned that level of support in October 2003, perhaps a lingering effect of the surge in government trust after the September 2001 terror attacks. Not since April 2002 have a majority of Americans approved of the Democrats in Congress.
Even shortly after Democrats regained majority status in Congress in early 2007, just 41% of Americans approved of the job the party was doing.
Approval Is in the Eye of the Beholder
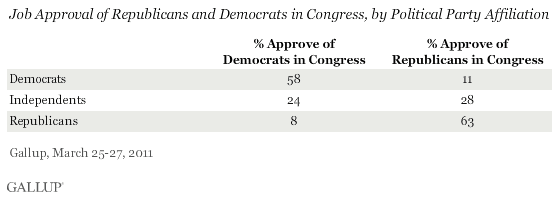
Though Americans are generally down on Congress, they do seem positively disposed to their own party's congressional caucus. The poll finds 63% of Republicans approving of the job the Republicans in Congress are doing, and 58% of Democrats approving of the job the Democrats in Congress are doing. On the flip side, Democrats and Republicans give very low ratings to the opposition party. Fewer than 3 in 10 independents approve of either party in Congress.

Even though a majority of Republicans and Democrats approve of the job their preferred party is doing in Congress, the ratings are still relatively weak compared with what partisans give to the president of their own party. For example, roughly 8 in 10 Democrats currently approve of the job President Obama is doing, compared with their 58% approval rating for Democrats in Congress. George W. Bush's job approval rating averaged above 80% among Republicans while he was president.
Implications
Congress faces difficult challenges in trying to jump-start the economy while also reining in spending as Americans grow increasingly weary of the federal budget deficit. The difficulty of these tasks is compounded by divided party control of Congress, with Republicans in the majority in the House of Representatives and Democrats controlling the Senate. To date, Congress has struggled to find agreement on long-term budget solutions, opting instead for short-term agreements to avoid a government shutdown. Its ability to do so, particularly this week, with the looming April 8 deadline to pass a 2011 budget or a continuing resolution, could play a crucial role in determining whether Americans' views of Congress improve or deteriorate.
Survey Methods
Results for this Gallup poll are based on telephone interviews conducted March 25-27, 2011, with a random sample of 1,027 adults, aged 18 and older, living in the continental U.S., selected using random-digit-dial sampling.
For results based on the total sample of national adults, one can say with 95% confidence that the maximum margin of sampling error is ±4 percentage points.
Interviews are conducted with respondents on landline telephones (for respondents with a landline telephone) and cellular phones (for respondents who are cell phone-only). Each sample includes a minimum quota of 150 cell phone-only respondents and 850 landline respondents, with additional minimum quotas among landline respondents for gender within region. Landline respondents are chosen at random within each household on the basis of which member had the most recent birthday.
Samples are weighted by gender, age, race, education, region, and phone lines. Demographic weighting targets are based on the March 2010 Current Population Survey figures for the aged 18 and older non-institutionalized population living in continental U.S. telephone households. All reported margins of sampling error include the computed design effects for weighting and sample design.
In addition to sampling error, question wording and practical difficulties in conducting surveys can introduce error or bias into the findings of public opinion polls.
View methodology, full question results, and trend data.
For more details on Gallup's polling methodology, visit www.gallup.com.
