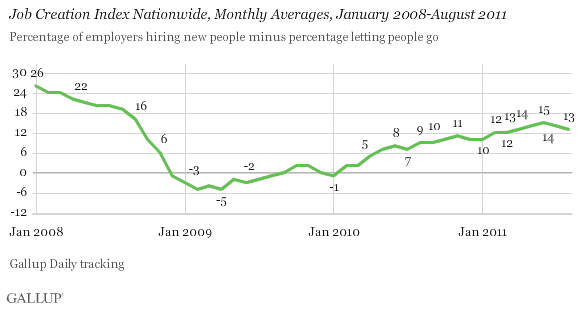
PRINCETON, NJ -- Job market conditions in the United States deteriorated for the second month in a row as Gallup's Job Creation Index fell to +13 in August, down from +14 in July and +15 in June. Net new hiring is at about the level it was during the recession of late 2008.

Both Hiring and Firing at Bottom of Their Recent Range
The August Job Creation Index of +13 is based on 32% of workers nationwide saying their employers are hiring and 19% saying their employers are letting workers go. These percentages have not varied much recently: 18% or 19% over the past 10 months have said their employers are reducing staff size, while between 32% and 33% since April have said their employers are hiring. The August index percentages are thus at the bottom of their recent range.

Job Market Conditions Deteriorate in the East and West
Job market conditions worsened in the East and West in August -- with the Job Creation Index for both regions declining to +10, from +13 in July.
However, job conditions improved in the Midwest, climbing to +19 in August from +17 in July. Conditions were unchanged in the South.

Implications
The continued -- though not pronounced -- decline in Gallup's Job Creation Index suggests job market conditions have deteriorated more than the government's weekly jobless claims (which have stabilized around 400,000) show. Similarly, Gallup's August unemployment data also suggest a higher unemployment rate than the 9.1% the government reported Friday. This may partly result from differences between Gallup's and the government's household survey methodologies (detailed in the table below). One key difference is that the government seasonally adjusts its unemployment data, while Gallup does not.
On the other hand, Gallup's unemployment results seem consistent with the finding of the government's establishment survey -- a survey of businesses concerning employment -- that zero new jobs were created in August. This lack of job growth should lead to greater unemployment. Regardless, it seems clear that the job situation is deteriorating and Gallup finds that many Americans are worried about their jobs.
In Wednesday's debate, jobs will likely be an important topic for the Republican presidential candidates. On Thursday, President Obama will address a joint session of Congress, laying out his new jobs plan. Meanwhile, many investors are looking to see if the Fed will try to re-create its efforts of a year ago to stimulate Wall Street by flooding the economy with more money.
Gallup's data suggest the American consumer remains highly pessimistic about job market conditions as well as the direction of the U.S. economy. While the results of government leaders' efforts to improve the jobs situation are unclear, changing the current consumer psychology will be key to their success.
Gallup.com reports results from these indexes in daily, weekly, and monthly averages and in Gallup.com stories. Complete trend data are always available to view and export in the following charts:
Daily: Employment, Economic Confidence and Job Creation, Consumer Spending
Weekly: Employment, Economic Confidence, Job Creation, Consumer Spending
Read more about Gallup's economic measures.
View our economic release schedule.
Survey Methods
For Gallup Daily tracking, Gallup interviews approximately 1,000 national adults, aged 18 and older, each day. The Gallup Job Creation Index results are based on a random sample of approximately 500 current full- and part-time employees each day.
National results for August are based on Gallup Daily tracking interviews with 16,927 employees conducted Aug. 1-31, 2011. For this sample, one can say with 95% confidence that the maximum margin of sampling error is ±1 percentage point. Regional results for August are based on interviews totaling more than 3,000 in each region. For each total regional sample, the maximum margin of sampling error is ±3 percentage points.
Interviews are conducted with respondents on landline telephones and cellular phones, with interviews conducted in Spanish for respondents who are primarily Spanish-speaking. Each sample includes a minimum quota of 400 cell phone respondents and 600 landline respondents per 1,000 national adults, with additional minimum quotas among landline respondents by region. Landline telephone numbers are chosen at random among listed telephone numbers. Cell phone numbers are selected using random-digit-dial methods. Landline respondents are chosen at random within each household on the basis of which member had the most recent birthday.
Samples are weighted by gender, age, race, Hispanic ethnicity, education, region, adults in the household, and phone status (cell phone only/landline only/both, cell phone mostly, and having an unlisted landline number). Demographic weighting targets are based on the March 2010 Current Population Survey figures for the aged 18 and older non-institutionalized population living in U.S. telephone households. All reported margins of sampling error include the computed design effects for weighting and sample design.
In addition to sampling error, question wording and practical difficulties in conducting surveys can introduce error or bias into the findings of public opinion polls.
For more details on Gallup's polling methodology, visit www.gallup.com.
