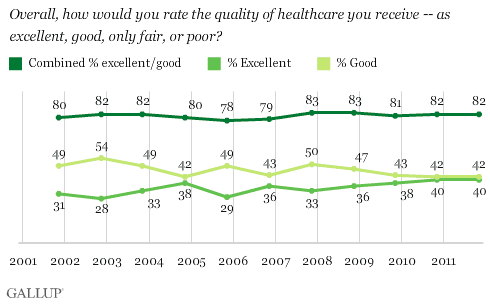
PRINCETON, NJ -- Forty percent of Americans rate the quality of healthcare they receive as "excellent," tying the high reached last year, and marking a significant increase from 33% four years ago. An additional 42% now rate the quality of healthcare they receive as "good," resulting in 82% giving it a positive rating. That combined excellent/good percentage has been fairly steady at around 80% since 2001.

These results are based on Gallup's annual Health and Healthcare survey, conducted each November since 2001.
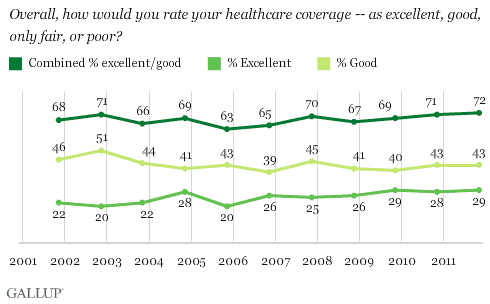
The Nov. 3-6 poll finds that Americans also evaluate their healthcare coverage positively, though to a slightly lesser degree than the quality of healthcare they receive. Roughly 7 in 10 Americans have rated their healthcare coverage as excellent or good since 2001. Here again, there has been a slight uptick in the percentage giving excellent ratings, with 29% now rating their coverage this positively, up from 25% four years ago.

Generally speaking, Americans are much more positive about these two aspects of their own healthcare than about the same aspects of healthcare in the United States as a whole. Gallup has found this disparity consistently in the annual Healthcare survey.
Excellent Ratings Up Among Most Subgroups, but Not Equally So
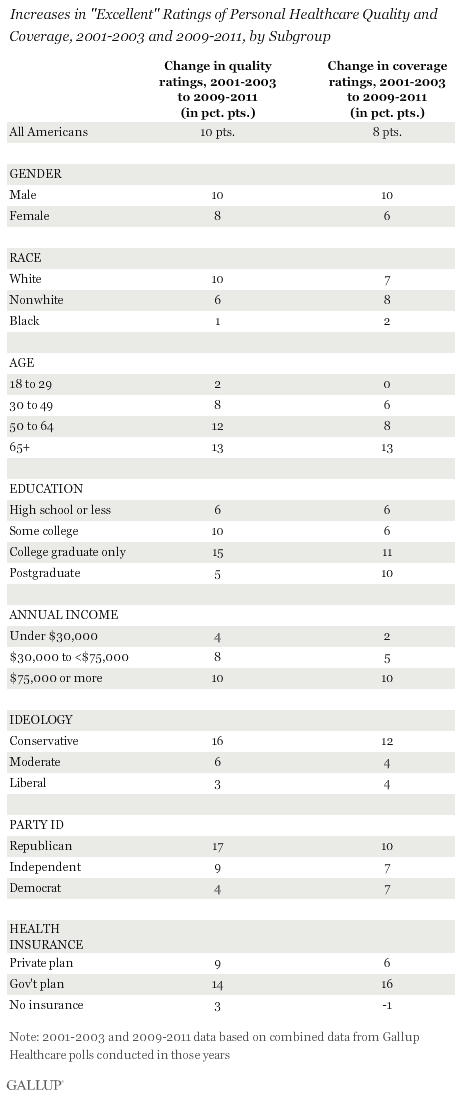
There has been a 10-percentage-point increase in excellent ratings of healthcare quality and an 8-point increase in excellent ratings of healthcare coverage among all Americans on average in 2009-2011 compared with 2001-2003, according to an analysis of aggregated data from those years.
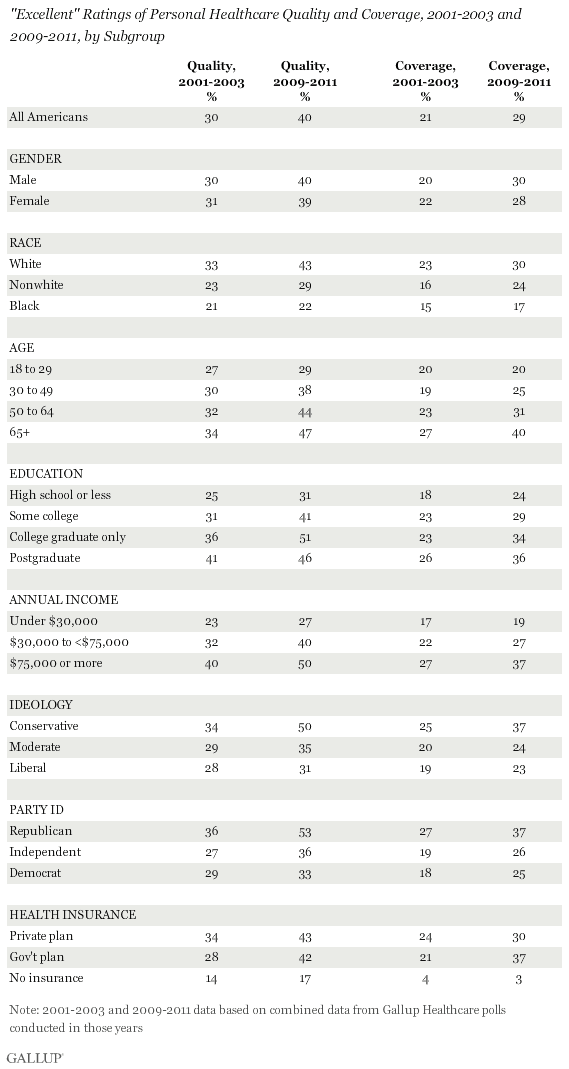
The increase in excellent ratings of the quality and coverage of Americans' own healthcare in recent years is generally evident among all key subgroups, but is proportionately greater among two of them -- those on the political right and those who have a government health insurance plan. (For the complete data on 2001-2003 and 2009-2011 ratings by subgroup, see page 2.)
Republicans' excellent ratings of their healthcare quality and coverage are up 17 points and 10 points, respectively. Conservatives' ratings of quality are up 16 and of coverage up 12 points. Those who are on a government-sponsored health plan such as Medicare or Medicaid show increased excellent ratings of 14 points on quality and 16 points on coverage. Because most of those on government health plans are senior citizens who have Medicare coverage, Americans aged 65 and older also show significantly more positive ratings of their healthcare now than they did at the beginning of the last decade.

The gains in excellent ratings among government healthcare recipients and seniors could reflect the addition of a prescription drug benefit to Medicare, passed in 2003.
The gains in Republicans' and conservatives' ratings could be more of a political reaction. Gallup found sharp gains in Republicans' views of healthcare coverage in the nation as a whole in 2009 and 2010, while their ratings of quality remained above the national average. This occurred amid the Obama administration's attempts to pass a federal healthcare plan, which the president signed into law in March 2010. Republicans largely opposed the efforts, which may have caused them to view the pre-Obama administration status quo more positively, given the changes to the U.S. healthcare system.
Implications
Despite the widespread focus on attempts to reform the U.S. healthcare system, Americans remain largely positive about their own healthcare quality and coverage, consistent with what Gallup has found for more than a decade. However, in recent years there has been an increase in the intensity of this opinion, with more rating each aspect as excellent than was true before 2009.
It appears that some of the increase in excellent ratings of personal and national healthcare in recent years is a reaction to the healthcare reform efforts undertaken by President Obama. And, given the results by subgroup, which show greater gains among Republicans and conservatives, more of that reaction could be coming from a position opposed to those efforts than a positive reaction to them.
Much of the healthcare law's provisions have yet to take effect, and its status remains in doubt, given legal challenges to the law that the Supreme Court will decide next year, and possible attempts to repeal it by future presidents and Congresses. The ultimate fate of the law, and how that affects Americans' own healthcare, suggests Americans' views of healthcare quality and coverage have the potential to change significantly in the coming years.
Survey Methods
Results for this Gallup poll are based on telephone interviews conducted Nov. 3-6, 2011, with a random sample of 1,012 adults, aged 18 and older, living in all 50 U.S. states and the District of Columbia.
For results based on the total sample of national adults, one can say with 95% confidence that the maximum margin of sampling error is ±4 percentage points.
Interviews are conducted with respondents on landline telephones and cellular phones, with interviews conducted in Spanish for respondents who are primarily Spanish-speaking. Each sample includes a minimum quota of 400 cell phone respondents and 600 landline respondents per 1,000 national adults, with additional minimum quotas among landline respondents by region. Landline telephone numbers are chosen at random among listed telephone numbers. Cell phone numbers are selected using random-digit-dial methods. Landline respondents are chosen at random within each household on the basis of which member had the most recent birthday.
Samples are weighted by gender, age, race, Hispanic ethnicity, education, region, adults in the household, and phone status (cell phone only/landline only/both, cell phone mostly, and having an unlisted landline number). Demographic weighting targets are based on the March 2010 Current Population Survey figures for the aged 18 and older non-institutionalized population living in U.S. telephone households. All reported margins of sampling error include the computed design effects for weighting and sample design.
In addition to sampling error, question wording and practical difficulties in conducting surveys can introduce error or bias into the findings of public opinion polls.
View methodology, full question results, and trend data.
For more details on Gallup's polling methodology, visit www.gallup.com.

