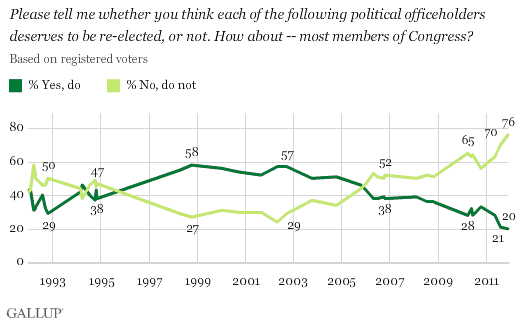
PRINCETON, NJ -- About three-quarters of registered voters (76%) say most members of Congress do not deserve re-election, the highest such percentage Gallup has measured in its 19-year history of asking this question. The 20% who say most members deserve to be re-elected is also a record low, by one percentage point.

This finding is from a Nov. 28-Dec. 1 Gallup poll, adding to the broad negativity toward Congress Americans have expressed this year. These include historically low congressional job approval ratings, low ratings of confidence in the legislative branch of government, and low ratings of confidence in Congress as an institution.
The 76% who say most members of Congress "do not deserve to be re-elected" is six points higher than the previous high of 70%, measured in August.
The trends on this measure have been progressively more negative since 2004. Voters were also more negative than positive in response to this measure through most of the early 1990s, but at least half of voters said most members deserved to be re-elected in Gallup polls conducted between 1998 and 2004.
A substantial majority of Republican (75%), independent (82%), and Democratic (68%) voters agree that most members of Congress do not deserve re-election -- a sign of rare consensus about the legislative body in which both parties currently hold a leadership stake.
Majority Would Cast a "Yea" Vote for Their Own Member of Congress
As has historically been the case, voters are much more positive about the U.S. representative from their own congressional district than they are about "most members of Congress," with 53% saying their representative deserves to be re-elected, while 39% hold the opposite view.

These opinions about voters' local representatives in Congress are historically low, but not record lows. Twice in 2010, 49% of voters said their representative deserved to be re-elected, along with the historical low of 48% in 1992. In three separate surveys in 2010, 40% said their local representative did not deserve to be re-elected.
More Than 4 in 10 Say Obama Deserves Re-Election
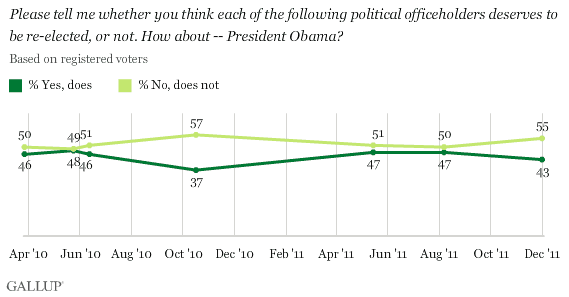
Voters' views about President Obama's re-election fall in between their views of most members of Congress and of their local representative. Forty-three percent say Obama deserves to be re-elected, while 55% say he does not. The "deserves" percentage is slightly lower than Gallup measured in August and May of this year, but above the low point of 37% measured in October 2010.

Obama's overall job approval rating in this Nov. 28-Dec. 1 survey is 43%, identical to his re-elect percentage. Gallup trends show that incumbent presidents since World War II who won their re-election bids had 48% or higher job approval ratings in the last Gallup rating before the election. Obama is thus currently below the historical threshold.
Implications
American voters' negative views about re-electing most members of Congress provide one more piece of evidence reinforcing the historically negative position of Congress in voters' minds.
How this antipathy toward Congress plays out in next year's congressional elections remains to be seen. Americans were not as negative last October, before the 2010 midterm elections, yet voters flipped 63 seats from Democratic to Republican control and gave the House to the GOP in the process. This was the largest seat gain by any party since 1948. If voters' current sentiments toward Congress prevail through next November's election, it is possible that control of the House would flip back to the Democrats, although such a conclusion is far from certain.
Those in Congress can take solace in voters' historically more positive views of re-electing their own member of Congress. While House elections clearly are affected by national "waves" of shifts in sentiment, these data suggest that members may be able to increase the chances of keeping their seats by playing up their local connection to voters in their districts -- at least for districts that will not be radically changed because of redistricting.
Survey Methods
Results for this Gallup poll are based on telephone interviews conducted Nov. 28-Dec. 1, 2011, with a random sample of 1,012 adults, aged 18 and older, living in all 50 U.S. states and the District of Columbia.
For results based on the total sample of 903 registered voters used in this analysis, one can say with 95% confidence that the maximum margin of sampling error is ±4 percentage points.
Interviews are conducted with respondents on landline telephones and cellular phones, with interviews conducted in Spanish for respondents who are primarily Spanish-speaking. Each sample includes a minimum quota of 400 cell phone respondents and 600 landline respondents per 1,000 national adults, with additional minimum quotas among landline respondents by region. Landline telephone numbers are chosen at random among listed telephone numbers. Cell phone numbers are selected using random-digit-dial methods. Landline respondents are chosen at random within each household on the basis of which member had the most recent birthday.
Samples are weighted by gender, age, race, Hispanic ethnicity, education, region, adults in the household, and phone status (cell phone only/landline only/both, cell phone mostly, and having an unlisted landline number). Demographic weighting targets are based on the March 2010 Current Population Survey figures for the aged 18 and older non-institutionalized population living in U.S. telephone households. All reported margins of sampling error include the computed design effects for weighting and sample design.
In addition to sampling error, question wording and practical difficulties in conducting surveys can introduce error or bias into the findings of public opinion polls.
View methodology, full question results, and trend data.
For more details on Gallup's polling methodology, visit www.gallup.com.
