This is the first article in an in-depth series on the state of health insurance coverage in America. Future articles will explore trends in types of health insurance coverage and uninsured rates across states.
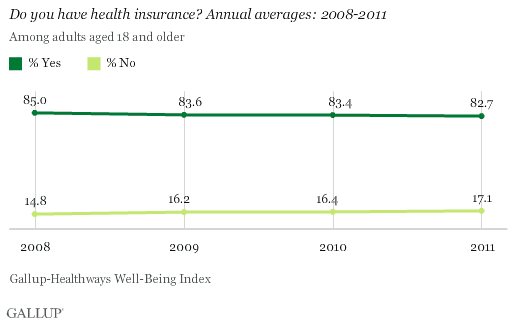
WASHINGTON, D.C. -- More American adults lacked health insurance coverage last year than in any year since Gallup and Healthways started tracking it in 2008. The uninsured rate has been increasing since 2008, climbing to 17.1% in 2011.

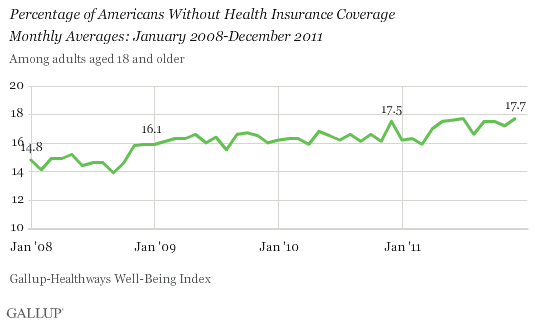
The Gallup-Healthways Well-Being Index asks 1,000 American adults each day about their healthcare coverage and reports monthly, quarterly, and annual averages. The monthly percentage of uninsured adults increased to 17.7% in December 2011, tying July for the highest on record. The uninsured rate was 17% or higher in most months in 2011.
Gallup first documented an increase in the monthly percentage of uninsured adults in November 2008, rising above 16% for the first time in February 2009 and above 17% for the first time December 2010.

Young Adults Seem to Benefit From New Healthcare Law
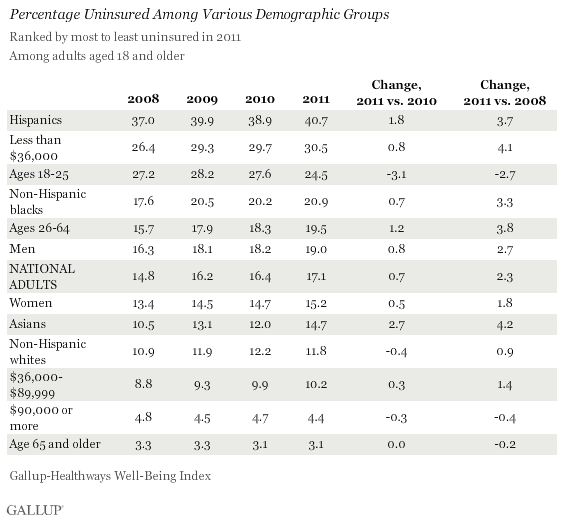
U.S. adults aged 18 to 25 -- who are now allowed to stay on their parents' plans until age 26 because of a provision of the 2010 healthcare law -- are less likely to be uninsured than in previous years. The percentage of uninsured declined further in 2011 to 24.5%, from 27.6% in 2010 and 28.2% in 2009. Although this group is still among the most likely to be uninsured, it is the only group Gallup tracks that has seen a significant decline in the percentage uninsured in 2011.
Hispanic Americans continue to be the most likely to be uninsured, with more than 40% going without health coverage in 2011, the highest Gallup has found for any key group since it began tracking in 2008. More than 30% of low-income Americans were uninsured in 2011 -- a figure that has been rising since 2008, when it was 26.4%.
High-income Americans and seniors -- two groups among the least likely to be uninsured -- have not seen an increase in the percentage uninsured over time.

Bottom Line
The U.S. health insurance system is undergoing great upheaval, which combined with the troubled economy of the past several years is clearly affecting health insurance coverage in the country. The Gallup-Healthways Well-Being Index data reveal that more Americans lack healthcare today than did four years ago. Groups that were already among the least likely to have coverage -- Hispanics, low-income Americans, and blacks -- have become even more likely to be uninsured. Meanwhile, seniors, most of whom qualify for Medicare, and high-income Americans not only remain among the least likely to lack coverage, but also have not seen their access decline in recent years.
The clear outlier is young adults. The percentage of Americans aged 18 to 25 who are uninsured has been declining since the fourth quarter of 2010. This decrease has coincided with the implementation of a provision of the new healthcare law that allows this age group to stay on their parents' plans. Gallup will continue to monitor young adults' health insurance coverage in 2012 to see whether more continue to gain access.
The most significant change to the U.S. healthcare system outlined in the Patient Protection and Affordable Care Act -- the provision requiring all adults to carry coverage -- has yet to go into effect and will not do so until 2014 -- that is if it isn't struck down this year when the Supreme Court rules on its legality. If that part of the law takes effect, coverage rates in America will surely change. However, with states and employers struggling to adjust and comply with the new rules, it is unclear how long it will take for changes to be seen at the national level.
About the Gallup-Healthways Well-Being Index
The Gallup-Healthways Well-Being Index tracks well-being in the U.S., U.K., and Germany and provides best-in-class solutions for a healthier world. To learn more, please visit well-beingindex.com.
Survey Methods
Results are based on telephone interviews conducted as part of the Gallup-Healthways Well-Being Index survey Jan. 1-Dec. 31, 2011, with a random sample of 353,492 adults, aged 18 and older, living in all 50 U.S. states and the District of Columbia, selected using random-digit-dial sampling.
For results based on the total sample of national adults, one can say with 95% confidence that the maximum margin of sampling error is ±0.2 percentage point.
For results based on subgroups, one can say with 95% confidence that the maximum margin of sampling error is ±1 percentage point.
Interviews are conducted with respondents on landline telephones and cellular phones, with interviews conducted in Spanish for respondents who are primarily Spanish-speaking. Each sample includes a minimum quota of 400 cell phone respondents and 600 landline respondents per 1,000 national adults, with additional minimum quotas among landline respondents by region. Landline telephone numbers are chosen at random among listed telephone numbers. Cell phone numbers are selected using random-digit-dial methods. Landline respondents are chosen at random within each household on the basis of which member had the most recent birthday.
Samples are weighted by gender, age, race, Hispanic ethnicity, education, region, adults in the household, and phone status (cell phone only/landline only/both, cell phone mostly, and having an unlisted landline number). Demographic weighting targets are based on the March 2010 Current Population Survey figures for the aged 18 and older non-institutionalized population living in U.S. telephone households. All reported margins of sampling error include the computed design effects for weighting and sample design.
In addition to sampling error, question wording and practical difficulties in conducting surveys can introduce error or bias into the findings of public opinion polls.
For more details on Gallup's polling methodology, visit www.gallup.com.
