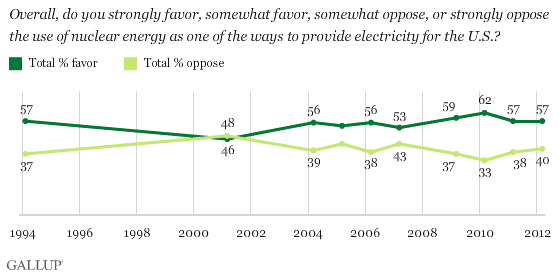
PRINCETON, NJ -- One year after the tsunami and resulting failure of the Fukushima nuclear power plant in Japan, a majority of Americans continue to favor the use of nuclear energy as one of the ways to provide electricity for the U.S. The 57% who favor nuclear power this year is identical to the percentage measured in early March 2011, just before the Fukushima incident.

These data are from Gallup's annual Environment survey, conducted March 8-11, 2012. Gallup in 1994 first asked Americans if they favored or opposed the use of nuclear power for electricity, and the 57% in favor at that point is identical to what is found today. The highest level of support for nuclear power was 62% in 2010. The lowest was 46% in March 2001, the only reading out of 10 in which less than half of Americans said they favored nuclear power.
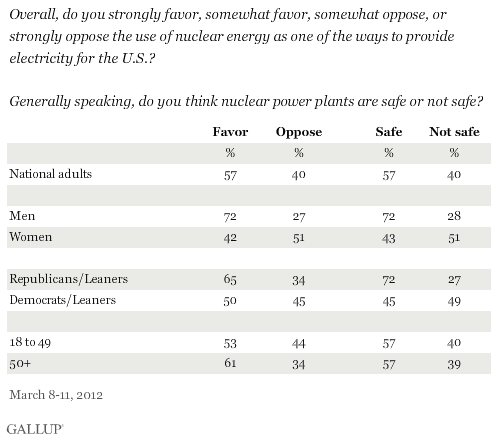
The majority of Americans also continue to think nuclear power plants are safe. Gallup has asked Americans this question three times over the past four years, and the positive responses each time have been within a narrow 56% to 58% range.

The extensive news coverage of the major problems the Fukushima reactors experienced after power was disrupted as a result of the massive tsunami that hit the Japanese coast on March 11, 2011, does not appear to have had a long-term effect on Americans' attitudes about nuclear power. Although attitudes may have shifted in the immediate aftermath of last year's incident, attitudes now are almost identical to those measured in last year's pre-disaster survey.
Men Much More Likely Than Women to Favor Nuclear Power
Men and women have sharply different attitudes about nuclear power, differences that are larger than those found between partisan, ideological, age, and educational segments of the population. Men favor nuclear power as a source of electricity by a 72% to 27% margin. But 51% of women oppose it, with 42% in favor. The same large gender gap exists in terms of views of the safety of nuclear power plants. The wide gender gap in attitudes about nuclear power has been found in previous years' surveys as well.

Republicans and Republican-leaning independents are more likely to favor the use of nuclear power than are Democrats and Democratic leaners, as they have consistently over the years, but at least half of each partisan group currently favors its use. Americans aged 50 and older are slightly more likely to be in favor of nuclear power than are those under 50, although age makes no difference in views on the safety of nuclear power plants.
Implications
The catastrophic failure of the Fukushima nuclear power plant in Japan last year, coupled with the resulting fears of leaked radiation, generated a great deal of news coverage concerning the future viability of nuclear power as a safe and reliable source of electricity. None of this, however, appears to have made much difference in the thinking of the average American one year after the incident. The 57% who now favor the use of nuclear power and who say nuclear power plants are safe are essentially unchanged from just prior to the Fukushima disaster.
Although Republicans continue to be more supportive than Democrats of the use of nuclear energy, these political differences are dwarfed by the 30-point gender gap in views on nuclear energy. Men are more likely than women to be Republicans, but politics alone do not explain the gap in support for nuclear energy between men and women. Something about nuclear energy apparently strikes a strongly negative chord in the minds of the nation's women, making them one of the few demographic segments of any type in which opposition to nuclear power is higher than 50%.
The future of nuclear energy in this country may be driven as much by economics as by safety concerns or public opinion. The ability to use new methods to extract natural gas from the nation's shale deposits in particular has flooded the energy marketplace with cheap natural gas. This makes the long-range projected return on investment from multibillion-dollar nuclear power plants more tenuous. But the majority of Americans would appear to be supportive if the industry does decide to build new plants in the future.
Survey Methods
Results for this Gallup poll are based on telephone interviews conducted March 8-11, 2012, with a random sample of 1,024 adults, aged 18 and older, living in all 50 U.S. states and the District of Columbia.
For results based on the total sample of national adults, one can say with 95% confidence that the maximum margin of sampling error is ±4 percentage points.
For results based on the sample of 521 national adults in Form A and 503 national adults in Form B, the maximum margins of sampling error are ±5 percentage points.
Interviews are conducted with respondents on landline telephones and cellular phones, with interviews conducted in Spanish for respondents who are primarily Spanish-speaking. Each sample includes a minimum quota of 400 cell phone respondents and 600 landline respondents per 1,000 national adults, with additional minimum quotas among landline respondents by region. Landline telephone numbers are chosen at random among listed telephone numbers. Cell phone numbers are selected using random-digit-dial methods. Landline respondents are chosen at random within each household on the basis of which member had the most recent birthday.
Samples are weighted by gender, age, race, Hispanic ethnicity, education, region, adults in the household, and phone status (cell phone only/landline only/both, cell phone mostly, and having an unlisted landline number). Demographic weighting targets are based on the March 2011 Current Population Survey figures for the aged 18 and older non-institutionalized population living in U.S. telephone households. All reported margins of sampling error include the computed design effects for weighting and sample design.
In addition to sampling error, question wording and practical difficulties in conducting surveys can introduce error or bias into the findings of public opinion polls.
View methodology, full question results, and trend data.
For more details on Gallup's polling methodology, visit www.gallup.com.
