PRINCETON, NJ -- President Barack Obama's job approval rating averaged 46% in March, up from 45% in January and February, and significantly improved over his term-low 41% monthly averages recorded last summer and fall.
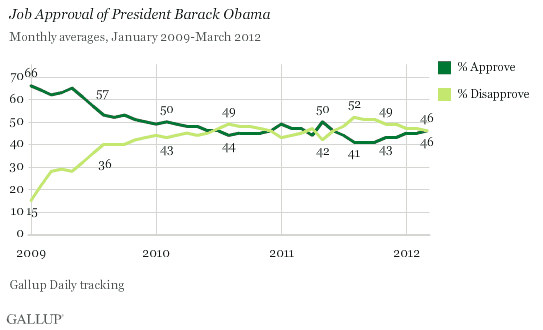
Obama's rating in Gallup's three-day rolling averages in April have become even more positive, including the president's first rating of 50% in nearly a year on Friday. It remains to be seen, however, whether his support will remain at that level for any length of time. Obama has not averaged 50% approval for a full month since last May, after the death of Osama bin Laden, and prior to that, not since February 2010.
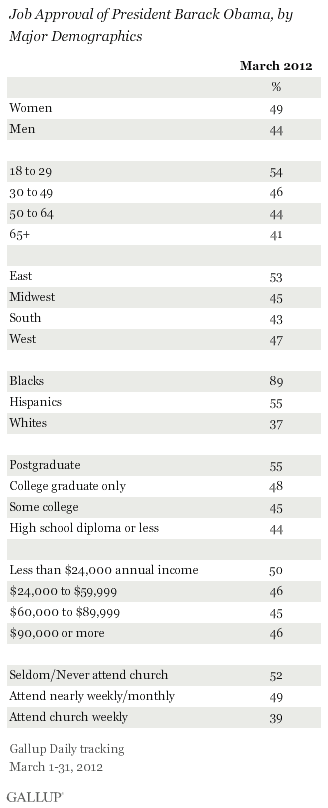
Despite the broad changes in President Obama's overall job approval rating since he became president, certain subgroups of the population have consistently rated him better than others, and these patterns continued in March. Blacks, Hispanics, women, 18- to 29-year-olds, Easterners, postgraduates, Americans earning less than $24,000 per year, and those who don't regularly attend a place of worship all show higher support for Obama than their counterparts.
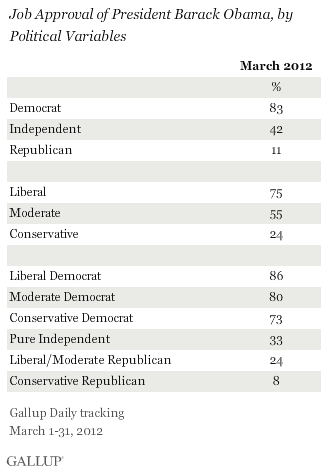
Additionally, most Democrats and liberals approve of Obama's job performance, as do the slight majority of moderates. His approval rating ranges from 86% among liberal Democrats to 8% among conservative Republicans, with 33% of pure independents in the center of the political spectrum approving.
Relative Support From Hispanics, Low-Income Americans Still Reduced
Obama's overall job approval ratings among his core support groups have followed mostly the same pattern as his overall rating since January 2009, and have thus stayed consistently above his overall approval rating by about the same margin from month to month. However, Gallup trends document a narrowing of his advantage among Hispanics.
The 55% of Hispanics approving of Obama in March was nine percentage points above the national average, and that gap is typical for Hispanics' approval relative to the national average over the past year. Prior to that, however, Hispanics' approval was routinely between 10 and 20 points above average.
By contrast, for most of Obama's presidency, whites' approval has consistently been about eight or nine points below the national average, and blacks' approval has been about 40 points above it.
Thus, as Obama's overall approval rating from Americans declined from the 50s and 60s in his first year to the mid- to high 40s in his second year, and into the low to mid-40s in his third year, his support from Hispanics fell at a steeper rate than was seen among whites or blacks.
A similar pattern is seen among Americans making less than $24,000 per year. They continue to give Obama the highest approval ratings of any income group; however, the difference between low-income Americans' approval and everyone else's narrowed in 2010 and early 2011, although it has since widened somewhat.
Americans with college degrees, including those with postgraduate education, continue to rate Obama a bit higher than those with some or no college education. At the same time, however, this education gap has widened slightly during his presidency. This separation of the two groups' approval ratings reflects relative improvement over time among those with a college degree and a slight relative drop among those without a degree.
In March, his approval rating among the combined college graduate group was five points above his national average approval rating, while college nongraduates' approval was two points below it.
Bottom Line
President Obama's average monthly job approval rating has been inching up since last fall, rising from 41% in October to 45% in January, and reaching 46% in March. As his approval rating has expanded, and despite the variety of issues that have emerged at different times during his presidency, most of the demographic patterns of support for Obama seen at the outset of his presidency remain fixed. Groups that are above average in support for the president have stayed at roughly the same level above his overall approval rating from month to month, and those below average have also stayed roughly the same distance below his overall rating.
Hispanics, however, have shown a disproportionate decline in support for Obama, and the gap in his higher approval rating between low-income and less well-educated Americans and these groups' counterparts has grown.
Obama's re-election chances depend to a significant degree on his ability to increase his overall approval rating to the majority level, and this in turn will depend in part on his ability to maintain or increase support among Hispanics and among those with lower socioeconomic status.
Explore President Obama's approval ratings in depth and compare them with those of past presidents in the Gallup Presidential Job Approval Center.
Survey Methods
Results are based on telephone interviews conducted as part of Gallup Daily tracking March 1-31, 2012, with a random sample of 16,037 adults, aged 18 and older, living in all 50 U.S. states and the District of Columbia.
For results based on the total sample of national adults, one can say with 95% confidence that the maximum margin of sampling error is ±1 percentage point.
Interviews are conducted with respondents on landline telephones and cellular phones, with interviews conducted in Spanish for respondents who are primarily Spanish-speaking. Each sample includes a minimum quota of 400 cell phone respondents and 600 landline respondents per 1,000 national adults, with additional minimum quotas among landline respondents by region. Landline telephone numbers are chosen at random among listed telephone numbers. Cell phone numbers are selected using random-digit-dial methods. Landline respondents are chosen at random within each household on the basis of which member had the most recent birthday.
Samples are weighted by gender, age, race, Hispanic ethnicity, education, region, adults in the household, and phone status (cell phone only/landline only/both, cell phone mostly, and having an unlisted landline number). Demographic weighting targets are based on the March 2011 Current Population Survey figures for the aged 18 and older non-institutionalized population living in U.S. telephone households. All reported margins of sampling error include the computed design effects for weighting and sample design.
The questions reported here were asked of a random half-sample of respondents for 31 nights on the Gallup Daily tracking survey.
In addition to sampling error, question wording and practical difficulties in conducting surveys can introduce error or bias into the findings of public opinion polls.
For more details on Gallup's polling methodology, visit www.gallup.com.
