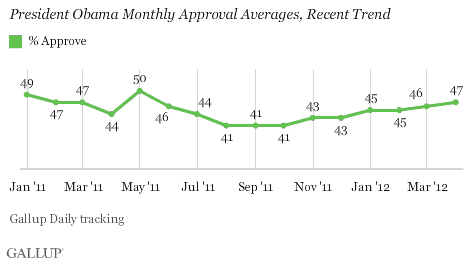
PRINCETON, NJ -- President Obama's job approval rating averaged 47% in April, Obama's highest monthly average since last May, when he averaged 50% after U.S. Marines killed Osama bin Laden in a May 2, 2011, raid.

By the end of last summer, Obama's monthly rating fell to a term-low 41% and remained in the low 40% range the rest of the year. His approval ratings now appear to be more solidly in the upper 40% range, after being in the mid-40s during the early part of this year.
On a few occasions in April, Obama's three-day approval average hit 50%, including on several days last week. His most recent ratings were a bit lower, and he finished the week with a 48% average.
That 48% average, which matches the average for the prior week, represents his highest weekly average since early last June, when the bin Laden rally effect was still evident.
Obama's Rating Climbing Most Among Independents
In April, Obama averaged 84% approval among Democrats, 43% among independents, and 12% among Republicans.
Compared with last August, when his monthly approval rating was 41%, his ratings are up among all groups, but more so among independents (eight percentage points) and Democrats (seven points) than Republicans (three points).

The improvement in Obama's approval rating among independents makes his ratings essentially even within that group, as 43% now approve and 45% disapprove of the job he is doing. In August, his approval-disapproval spread among independents was -18 points, with a 35% approval rating and a 53% disapproval rating.
Obama's ratings have especially improved among independent women, who are now more likely to approve (46%) than disapprove (42%) of the job he is doing. His rating remains net-negative among independent men, 41% approval and 49% disapproval.
Implications
President Obama's job approval rating has slowly but steadily improved since bottoming out last year. It is notable that his ratings are going up, given that recent incumbents who were defeated for re-election, Jimmy Carter and George H.W. Bush, saw their approval ratings generally headed downward in the election year. Those who were re-elected were generally above 50% for most if not all of the election year.
Still, at this stage, Obama's odds of being re-elected next November are not firmly established. Since Gallup began Daily tracking of registered voters' preferences in the 2012 election on April 11, Obama and likely Republican opponent Mitt Romney have essentially been tied, with 46% supporting each. That includes a 47% Romney-46% Obama division in the latest Gallup five-day average. Each candidate has had a brief period when he appeared to be leading, but in general, things have returned to an essentially even division, reflecting a close race.
The nature of the race in the remaining six months will largely be tied to Americans' ongoing assessments of the job President Obama is doing, especially his handling of economic problems. To the extent President Obama can keep the trend in his job evaluations up, particularly among political independents, he will be in a much stronger position for re-election.
Explore President Obama's approval ratings in depth and compare them with those of past presidents in the Gallup Presidential Job Approval Center.
Survey Methods
Results are based on telephone interviews conducted as part of Gallup Daily tracking April 1-29, 2012, with a random sample of 14,081 adults, aged 18 and older, living in all 50 U.S. states and the District of Columbia.
For results based on the total sample of national adults, one can say with 95% confidence that the maximum margin of sampling error is ±1 percentage point.
Interviews are conducted with respondents on landline telephones and cellular phones, with interviews conducted in Spanish for respondents who are primarily Spanish-speaking. Each sample includes a minimum quota of 400 cell phone respondents and 600 landline respondents per 1,000 national adults, with additional minimum quotas among landline respondents by region. Landline telephone numbers are chosen at random among listed telephone numbers. Cell phone numbers are selected using random-digit-dial methods. Landline respondents are chosen at random within each household on the basis of which member had the most recent birthday.
Samples are weighted by gender, age, race, Hispanic ethnicity, education, region, adults in the household, and phone status (cell phone only/landline only/both, cell phone mostly, and having an unlisted landline number). Demographic weighting targets are based on the March 2011 Current Population Survey figures for the aged 18 and older non-institutionalized population living in U.S. telephone households. All reported margins of sampling error include the computed design effects for weighting and sample design.
The questions reported here were asked of a random half-sample of respondents each night on the Gallup Daily tracking survey.
In addition to sampling error, question wording and practical difficulties in conducting surveys can introduce error or bias into the findings of public opinion polls.
For more details on Gallup's polling methodology, visit www.gallup.com.
