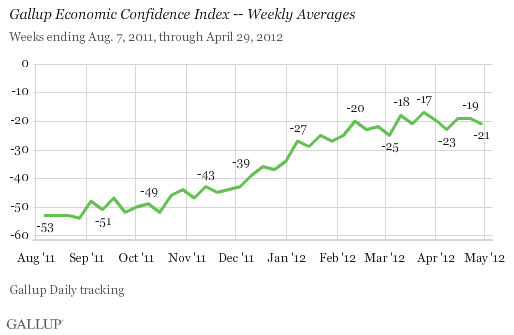
PRINCETON, NJ -- Gallup's Economic Confidence Index averaged -20 in April, identical to confidence in March and slightly improved over -22 in February and -27 in January. Although this is the first month since last September that monthly confidence did not improve to any extent, it remains steady at the highest level Gallup has recorded since initiating Daily tracking at the start of 2008.

Whether confidence will resume its upward trajectory in May is unclear given the direction of recent weekly averages. Confidence dipped to -21 in the last week of April, after two -19 readings in the middle of the month. By contrast, confidence rose above -19 twice in March, helping to overcome a -25 reading at the start of the month.

The Gallup Economic Confidence Index is an average of two components of consumers' psychology: Americans' ratings of current economic conditions and their perceptions of whether the economy is getting better or getting worse. The Index has a theoretical maximum of +100, obtained if all Americans say the economy is excellent or good and improving. The Index could go as low as -100 if all Americans perceive the economy as poor and getting worse.
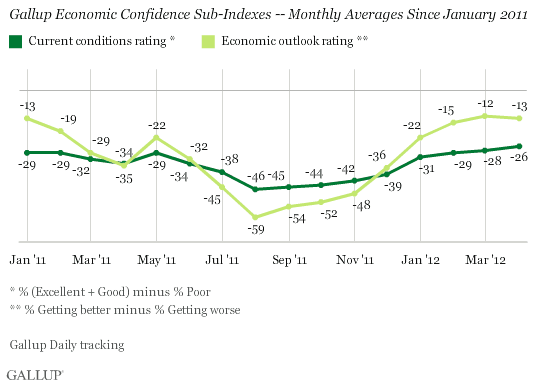
Both components of the index are statistically unchanged compared with their March levels. Americans' net evaluation of current economic conditions, at -26, continues to be worse than their economic outlook, at -13, a pattern that took hold in January.

Bottom Line
The strong rebound in Americans' confidence in the economy that has occurred since last summer has tapered off, and, with weekly averages in April failing to match the best weekly averages recorded in March, it is unclear what will happen in May.
Increasing public optimism about the economy's direction has been the main engine of the recent recovery in confidence. The outlook component increased by 46 points (from -59 in August to -13 in April), while the current conditions component increased by 20 points, from -46 to -26. As a result, optimism now leads current conditions. However, there may be a limit to how high economic optimism can go without perceptions of current conditions rising significantly as well. As long as ratings of current conditions continue to stagnate or rise by only a few points each month, a full recovery of economic confidence into positive territory could still be a long way off.
Gallup.com reports results from these indexes in daily, weekly, and monthly averages and in Gallup.com stories. Complete trend data are always available to view and export in the following charts:
Daily: Employment, Economic Confidence, Job Creation, Consumer Spending
Weekly: Employment, Economic Confidence, Job Creation, Consumer Spending
Read more about Gallup's economic measures.
View our economic release schedule.
Survey Methods
Results are based on telephone interviews conducted as part of Gallup Daily tracking April 1-30, 2012, with a random sample of 13,642 adults, aged 18 and older, living in all 50 U.S. states and the District of Columbia.
For results based on the total sample of national adults, one can say with 95% confidence that the maximum margin of sampling error is ±1 percentage point.
Interviews are conducted with respondents on landline telephones and cellular phones, with interviews conducted in Spanish for respondents who are primarily Spanish-speaking. Each sample includes a minimum quota of 400 cell phone respondents and 600 landline respondents per 1,000 national adults, with additional minimum quotas among landline respondents by region. Landline telephone numbers are chosen at random among listed telephone numbers. Cell phone numbers are selected using random-digit-dial methods. Landline respondents are chosen at random within each household on the basis of which member had the most recent birthday.
Samples are weighted by gender, age, race, Hispanic ethnicity, education, region, adults in the household, and phone status (cell phone only/landline only/both, cell phone mostly, and having an unlisted landline number). Demographic weighting targets are based on the March 2011 Current Population Survey figures for the aged 18 and older non-institutionalized population living in U.S. telephone households. All reported margins of sampling error include the computed design effects for weighting and sample design.
The questions reported here were asked of a random half-sample of respondents for 28 nights on the Gallup Daily tracking survey.
In addition to sampling error, question wording and practical difficulties in conducting surveys can introduce error or bias into the findings of public opinion polls.
For more details on Gallup's polling methodology, visit www.gallup.com.
