WASHINGTON, D.C. -- Americans report spending $151 on food per week on average. One in 10 Americans say they spend $300 or more per week and, at the other extreme, 8% spend less than $50.

Gallup has asked a version of this question as far back as 1943, but has not asked it since 1987. In 1943, an average of $15 per week was spent on food. The final 1987 estimate was $106.
But the increases in weekly food spending over time largely reflect the impact of inflation. On a relative basis, after adjusting prior years' data for inflation to 2012 dollars, Americans are spending less on food now than in the past. The average $151 Americans report spending each week on food today is down from the inflation-adjusted $157 to $214 range Gallup found throughout the mid- to late 1980s, the last time it regularly asked the question.
Adjusting the historical data to 2012 dollars also reveals that Americans' weekly spending on food began to decline in the 1970s, after rising to a high of $234 in 1966 and 1967. That generally downward trend was interrupted by a spike in 1987.

Data from the U.S. Bureau of Labor Statistics Consumer Expenditure Survey -- available from 1984 to 2010 -- confirm the generally downward trend Gallup finds in weekly reported average spending on food since the late 1980s. The BLS figures, adjusted for inflation, show Americans' spending on food declined to $124 a week in 2010, from a high of $148 in 1989.

Young Adults and Those With Higher Incomes Spend the Most
Young adults' average weekly food spending is $173, more than what older Americans say they spend. Those with incomes of $75,000 or more per year are averaging $180 per week, compared with $144 for those with incomes of $30,000 to $74,999, and $127 for the lowest income group. And adults with children younger than 18 living at home spend $30 more per week on average than those who don't have children younger than this age in the home.
Men spend slightly more than women and those in the Midwest spend slightly less than those elsewhere in the country.

Most Americans Still Eat at Home
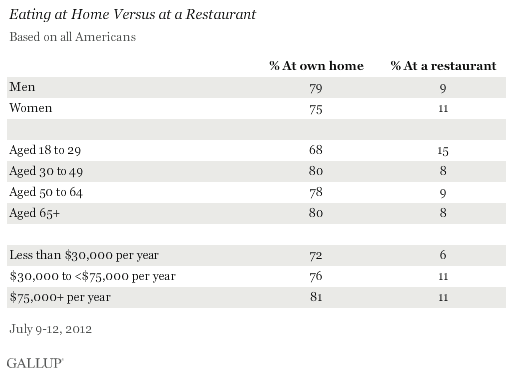
Seventy-seven percent of Americans reported eating dinner at home the day before the survey, essentially unchanged from the 80% who said so in 1989, the last time Gallup asked the question. The 10% who said they ate at a restaurant "last night" is also on par with the 8% recorded in 1989.

Large majorities of men and women and Americans of all ages and income levels report that they ate dinner at home. But young adults and those with middle and higher incomes are slightly more likely to say they ate out than are older adults and those who have lower incomes.

Implications
While Americans' spending on food appears to be down compared with the past, this may change quickly if food prices spike in reaction to the worsening drought in the Midwest, which is adversely affecting crops such as corn and soybeans. Food prices may rise by up to 3.5% this year and another 3% to 4% in 2013, according to the U.S. Department of Agriculture.
While Gallup Daily tracking finds Americans' confidence in the economy declining in July, this and concerns about food prices do not appear to be affecting consumer spending in general yet. However, spending may follow suit and take a hit in the near future.
Because young adults and those with higher incomes currently spend the most on food and are most likely to say they ate out "last night," these two groups -- should these negative economic trends continue -- may be among the first to ratchet back the amount of cash they put toward food.
Survey Methods
Results for this Gallup poll are based on telephone interviews conducted July 9-12, 2012, with a random sample of 1,014 adults, aged 18 and older, living in all 50 U.S. states and the District of Columbia.
For results based on the total sample of national adults, one can say with 95% confidence that the maximum margin of sampling error is ±4 percentage points.
The estimates for average spending have a margin of sampling error of ±$7.
Interviews are conducted with respondents on landline telephones and cellular phones, with interviews conducted in Spanish for respondents who are primarily Spanish-speaking. Each sample includes a minimum quota of 400 cell phone respondents and 600 landline respondents per 1,000 national adults, with additional minimum quotas among landline respondents by region. Landline telephone numbers are chosen at random among listed telephone numbers. Cell phone numbers are selected using random-digit-dial methods. Landline respondents are chosen at random within each household on the basis of which member had the most recent birthday.
Samples are weighted by gender, age, race, Hispanic ethnicity, education, region, adults in the household, and phone status (cell phone only/landline only/both, cell phone mostly, and having an unlisted landline number). Demographic weighting targets are based on the March 2011 Current Population Survey figures for the aged 18 and older non-institutionalized population living in U.S. telephone households. All reported margins of sampling error include the computed design effects for weighting and sample design.
In addition to sampling error, question wording and practical difficulties in conducting surveys can introduce error or bias into the findings of public opinion polls.
View complete question responses and trends (PDF download).
For more details on Gallup's polling methodology, visit www.gallup.com.
