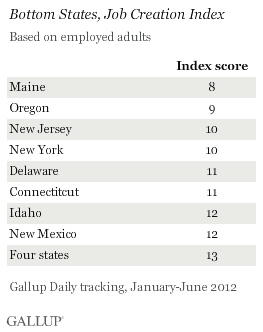
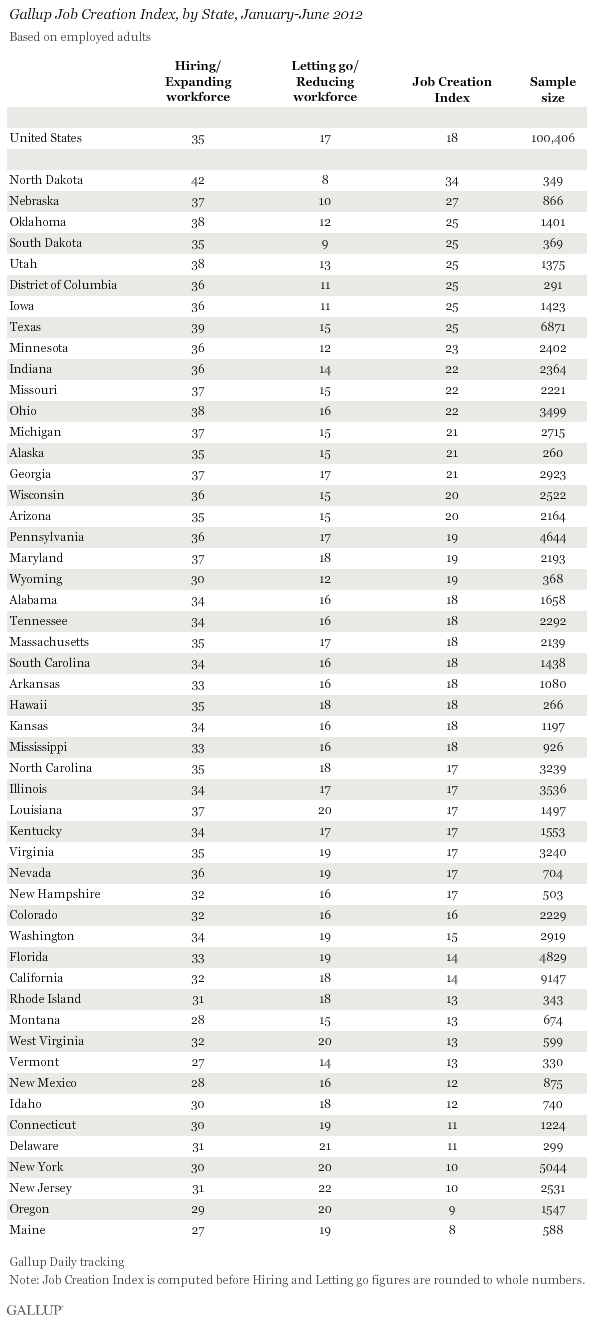
PRINCETON, NJ -- Workers in North Dakota reported the best hiring situation at their places of employment, with 42% saying their companies are hiring and expanding the size of their workforces versus 8% letting workers go and reducing the size of the workforce. The resulting Job Creation Index score of 34 is seven points better than that of any other state. Maine and Oregon have the lowest scores.


The data are based on Gallup Daily tracking interviews conducted with more than 100,000 U.S. workers from January through June. Gallup interviewed more than 500 workers in 42 states and more than 1,000 in 33 states during the first half of 2012. Full results for each state appear on page 2.
Nationally, in the first half of 2012, 35% of U.S. workers reported an increase in workforce size, while 17% reported a decrease, for an index score of 18. The national score is up from 13 in 2011 and 7 in 2010.
As in 2011, all states report a more positive than negative hiring situation. That was not the case in 2010 and in particular 2009, when more than half of the states had negative index scores, meaning more employees said their employers were reducing rather than increasing the size of their workforces.
Jobs Boom Continues in North Dakota
North Dakota's position atop the list is not unexpected, given that it ranked first in 2009, 2010, and 2011, and among the best states on the Job Creation Index in 2008. North Dakota's economy is benefiting from increased oil production, as well as strong technology and agriculture sectors. The positive jobs situation there is also creating a demand for construction work to build new homes, roads, and schools.
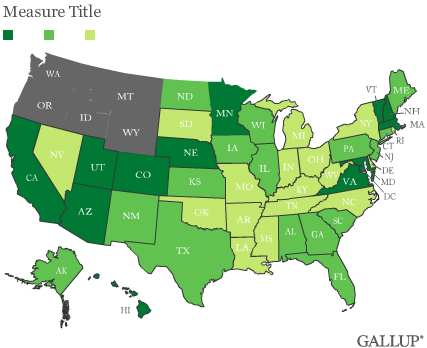
On a regional basis, job creation appears strongest in the upper Midwest, led by North Dakota, Nebraska, South Dakota, Minnesota, and Iowa, all among the top 10 states. Job creation is weakest in the Northeast, likely due to continuing difficulty in the financial sector, a major source of jobs in New York, Connecticut, and New Jersey, all among the bottom 10 states.

Implications
Job creation, based on reports from U.S. workers, appears more positive in 2012 to date than it was in 2011. Nationally, Gallup's Job Creation Index is improved from 2011, and most states' scores are up at least marginally in 2012 to date compared with 2011. Upper Midwestern states, particularly North Dakota, continue to report strong hiring situations.
Still, unemployment remains high, and Americans continue to rank jobs and unemployment as one of the most important problems facing the country.
Gallup will continue to update the national hiring situation in the U.S. throughout the remainder of 2012, and report on the final 2012 state estimates early next year. Given its large lead over every other state halfway through the year, it seems likely North Dakota will hold the top spot for a fourth consecutive year.
Gallup.com reports results from these indexes in daily, weekly, and monthly averages and in Gallup.com stories. Complete trend data are always available to view and export in the following charts:
Daily: Employment, Economic Confidence, Job Creation, Consumer Spending
Weekly: Employment, Economic Confidence, Job Creation, Consumer Spending
Read more about Gallup's economic measures.
View our economic release schedule.
Survey Methods
Results are based on telephone interviews conducted as part of Gallup Daily tracking January 2-June 30, 2012, with a random sample of 100,406 working adults, aged 18 and older, living in all 50 U.S. states and the District of Columbia.
For results based on the total sample of workers, one can say with 95% confidence that the maximum margin of sampling error is ±1 percentage point.
Margins of error for individual states are no greater than ±8 percentage points, and are ±3 percentage points in most states.
Interviews are conducted with respondents on landline telephones and cellular phones, with interviews conducted in Spanish for respondents who are primarily Spanish-speaking. Each sample includes a minimum quota of 400 cell phone respondents and 600 landline respondents per 1,000 national adults, with additional minimum quotas among landline respondents by region. Landline telephone numbers are chosen at random among listed telephone numbers. Cell phone numbers are selected using random-digit-dial methods. Landline respondents are chosen at random within each household on the basis of which member had the most recent birthday.
Samples are weighted by gender, age, race, Hispanic ethnicity, education, region, adults in the household, and phone status (cell phone only/landline only/both, cell phone mostly, and having an unlisted landline number). Demographic weighting targets are based on the March 2011 Current Population Survey figures for the aged 18 and older non-institutionalized population living in U.S. telephone households. All reported margins of sampling error include the computed design effects for weighting and sample design.
In addition to sampling error, question wording and practical difficulties in conducting surveys can introduce error or bias into the findings of public opinion polls.
For more details on Gallup's polling methodology, visit www.gallup.com.

