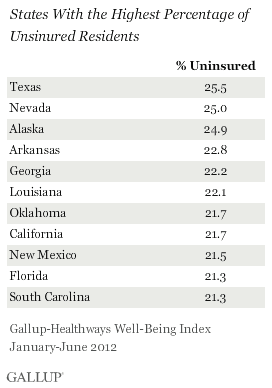
WASHINGTON, D.C. -- Texas residents continue to be the most likely in the U.S. to lack health insurance so far in 2012 (25.5%), and those in Massachusetts remain the least likely (4.1%). Nevada and Alaska are also among the states where residents are most likely to be uninsured, with about one in four lacking coverage.


These findings are from surveys conducted with 177,670 U.S. adults from January through June 2012 for the Gallup-Healthways Well-Being Index, marking a halftime report ahead of full-year 2012 data to be reported in early 2013.
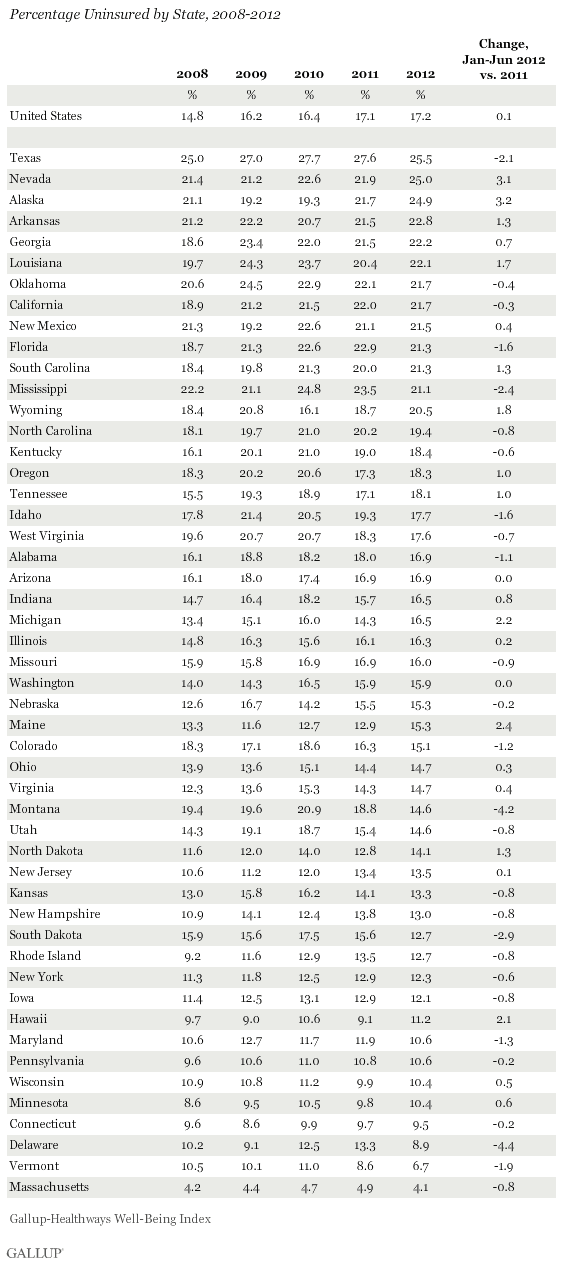
Nationwide, 17.2% of Americans lacked health insurance in January-June 2012, unchanged from the 17.1% who were uninsured in 2011. The stability in the national uninsured rate is reflected across states. The percentage of uninsured residents in nearly all states is statistically the same so far in 2012 compared with 2011.
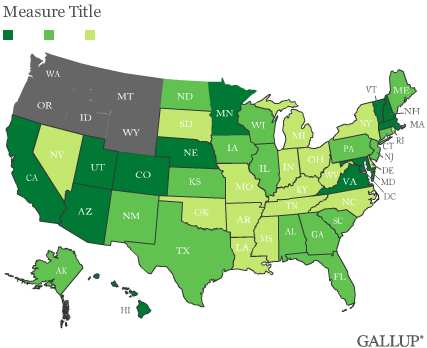
Adults living in the East and upper Midwest continue to be among the least likely to be uninsured. Residents of states in the South and West are still among the most likely in the country to lack health insurance coverage.
The geographic pattern of uninsured rates partly reflects the demographic and socioeconomic differences in coverage. States with larger percentages of low-income and Hispanic residents -- two groups who are among the most likely to be uninsured -- are generally more likely to have higher uninsured rates.

For complete results for each state, see page 2.
Bottom Line
Uninsured rates across states appear to be unchanged so far in 2012, reflecting the overall stability in the percentage of all Americans who lack health insurance -- 17.2% in January-June of this year. Texas and Massachusetts continue to be at the extremes, as they have been since 2008, with more than one in four residents lacking coverage in the former, and less than 5% in the latter.
As states work to comply with the new provisions under the Affordable Care Act -- now that the law has been upheld by the U.S. Supreme Court -- it is likely that more Americans will gain coverage in 2013 and 2014 as all pieces of the legislation come into effect. Whether certain states are able to implement the changes faster and more efficiently than others, and thus affect their uninsured rate more quickly, remains to be seen.
Survey Methods
Results are based on telephone interviews conducted as part of Gallup Daily tracking/the Gallup Healthways Well-Being Index survey January through June 2012, with a random sample of 177,670 adults, aged 18 and older, living in all 50 U.S. states and the District of Columbia.
For results based on the total sample of national adults, one can say with 95% confidence that the maximum margin of sampling error is ±0.3 percentage points.
The margin of sampling error for most states is ±1 to ±2 percentage points, but is as high as ±4 points for smaller states such as Wyoming, North Dakota, South Dakota, Delaware, and Hawaii.
Interviews are conducted with respondents on landline telephones and cellular phones, with interviews conducted in Spanish for respondents who are primarily Spanish-speaking. Each sample includes a minimum quota of 400 cell phone respondents and 600 landline respondents per 1,000 national adults, with additional minimum quotas among landline respondents by region. Landline telephone numbers are chosen at random among listed telephone numbers. Cell phones numbers are selected using random digit dial methods. Landline respondents are chosen at random within each household on the basis of which member had the most recent birthday.
Samples are weighted by gender, age, race, Hispanic ethnicity, education, region, adults in the household, and phone status (cell phone-only/landline only/both, cell phone mostly, and having an unlisted landline number). Demographic weighting targets are based on the March 2011 Current Population Survey figures for the aged 18 and older non-institutionalized population living in U.S. telephone households. All reported margins of sampling error include the computed design effects for weighting and sample design.
In addition to sampling error, question wording and practical difficulties in conducting surveys can introduce error or bias into the findings of public opinion polls.
For more details on Gallup's polling methodology, visit www.gallup.com.

