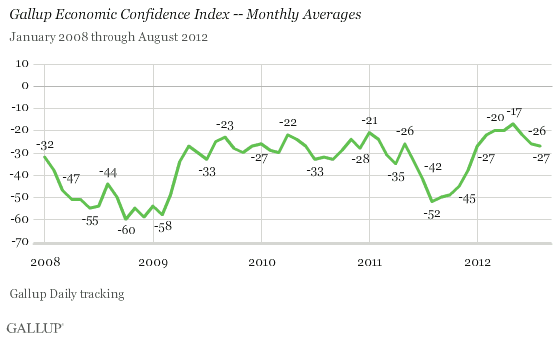
PRINCETON, NJ -- The Gallup Economic Confidence Index registered -27 in August, matching the prior monthly low for the year, recorded in January. August's reading is essentially the same as July's -26; still, confidence has now slid 10 percentage points from the four-year high of -17 recorded in May.

Despite the recent decline, confidence in August remains significantly brighter than a year ago; in August 2011 it was -52 after turmoil on Wall Street and Capitol Hill over raising the U.S. debt ceiling. It is also slightly better than in August 2010 (-32) but on par with August 2009 (-25). Confidence hit its lowest level in Gallup Daily tracking, -60, in October 2008.
Economic Outlook at Lowest of 2012
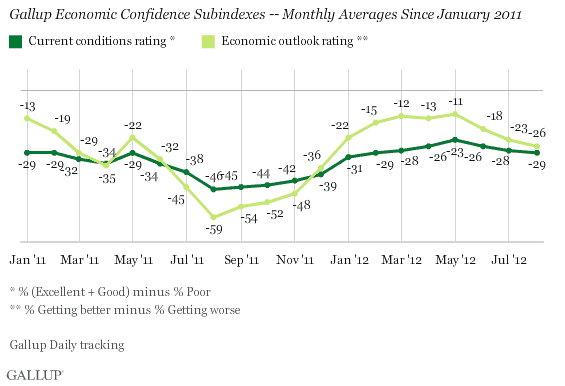
While both components of the index -- Americans' ratings of current economic conditions and their perceptions of the economy's direction -- were down in August, the outlook dimension slipped more, falling three points to -26, from -23. As a result, Americans' economic outlook is now worse than in any month since December 2011.
Consumer perceptions of current economic conditions have not varied much in 2012. The -29 rating for August is just one point below the July average, and similar to levels seen from January through March.

Confidence Continues to Sag Among Non-Democrats
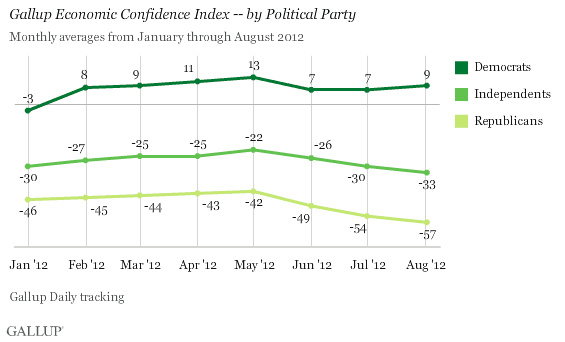
Continuing a pattern seen since July, economic confidence fell slightly last month among independents and Republicans -- down three points each -- while it held steady or even improved slightly among Democrats. The relatively high confidence among Democrats reflects the historical pattern: those who identify with the president's party are more upbeat in their economic attitudes than either independents or those who identify with the opposing party.

Forecast for September Confidence Looks No Brighter
Weekly averages of Gallup's Economic Confidence Index don't reveal any improvement during late August that might be expected to carry over into September. In fact, at -29, confidence was the lowest during the last week of August, amid the Republican National Convention, than in the prior four weeks of the month. However, the three-point drop from the beginning of August to the end, from -26 to -29, is less than was seen in July (six points) or June (eight points).

Bottom Line
Gallup has found waning public confidence in the economy since May, the last month the government reported any improvement -- albeit slight, at 8.1% for April, down from 8.2% in March -- in the nation's jobless rate. That same month, Gallup's monthly Economic Confidence Index rose three points to -17, its highest level since the start of Daily tracking in January 2008.
Since then, the government's unemployment reports have been disappointing, or mixed at best. The decline in confidence seen since May slowed in August, suggesting Americans may be growing accustomed to stagnant job growth. Gallup's own unemployment data suggest the next Bureau of Labor Statistics report, due out Friday, will offer more of the same -- either no change or an increase in the jobless rate.
Gallup's daily and weekly updates in mid-September will document nearly in real time how U.S. consumers react to whatever the BLS report shows.
Gallup.com reports results from these indexes in daily, weekly, and monthly averages and in Gallup.com stories. Complete trend data are always available to view and export in the following charts:
Daily: Employment, Economic Confidence, Job Creation, Consumer Spending
Weekly: Employment, Economic Confidence, Job Creation, Consumer Spending
Read more about Gallup's economic measures.
View our economic release schedule.
Survey Methods
Results are based on telephone interviews conducted as part of Gallup Daily tracking Aug. 1-31, 2012, with a random sample of 14,964 adults, aged 18 and older, living in all 50 U.S. states and the District of Columbia.
For results based on the total sample of national adults, one can say with 95% confidence that the maximum margin of sampling error is ±1 percentage point.
Interviews are conducted with respondents on landline telephones and cellular phones, with interviews conducted in Spanish for respondents who are primarily Spanish-speaking. Each sample includes a minimum quota of 400 cell phone respondents and 600 landline respondents per 1,000 national adults, with additional minimum quotas among landline respondents by region. Landline telephone numbers are chosen at random among listed telephone numbers. Cell phone numbers are selected using random-digit-dial methods. Landline respondents are chosen at random within each household on the basis of which member had the most recent birthday.
Samples are weighted by gender, age, race, Hispanic ethnicity, education, region, adults in the household, and phone status (cell phone only/landline only/both, cell phone mostly, and having an unlisted landline number). Demographic weighting targets are based on the March 2011 Current Population Survey figures for the aged 18 and older non-institutionalized population living in U.S. telephone households. All reported margins of sampling error include the computed design effects for weighting and sample design.
In addition to sampling error, question wording and practical difficulties in conducting surveys can introduce error or bias into the findings of public opinion polls.
For more details on Gallup's polling methodology, visit www.gallup.com.
