PRINCETON, NJ -- Many key economic and mood indicators are more positive now than in February 2009 when President Barack Obama first took office. However, there have been significant ups and downs during his 44 months as president.
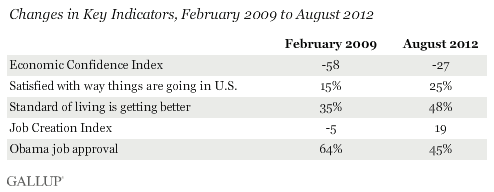
Economic Confidence Index: -27 Now vs. -58 Then
Gallup's Economic Confidence Index is higher now than it was when Obama took office, but the improvement is largely based on a quick recovery in 2009 from the near-record low of -58 in Obama's first full month in office in February 2009. Since that time, economic confidence has been relatively stable, with a sharp dip in the late summer of 2011.
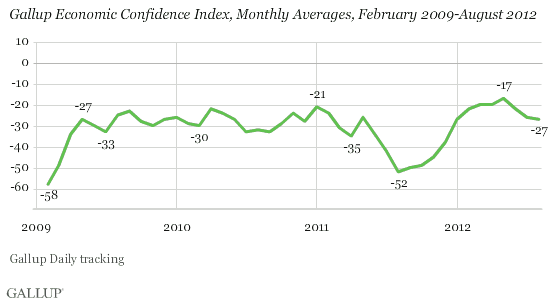
The index rose rapidly to -23 by September 2009 and, albeit with some fluctuation over the next year and a half, reached -21 in January 2011. The bottom dropped out in the summer of 2011, before and after the debt ceiling crisis in Congress and the parallel drop in the U.S. stock market. The -52 reading in August 2011 was almost as low as when Obama took office. Americans' economic confidence then improved, reaching -17 in May of this year, its highest point during the Obama administration. Economic confidence has since settled back down, dropping to -27 in August -- still higher than where it had begun in February 2009, and slightly better than the average of -31 across Obama's term so far.
Despite the ups and downs, economic confidence has been remained negative while Obama has been in office, meaning Americans have remained more likely to rate the economy as poor than as excellent or good, and more likely to say the economy is getting worse than to say it's getting better. By contrast, when George W. Bush was seeking re-election in September 2004, both the current conditions and outlook measures were at least slightly more positive than negative. And when Bill Clinton was seeking re-election in 1996, a late August/early September poll showed that both indices were significantly more positive than negative.
Satisfaction With the Way Things Are Going in the U.S.: 25% Now vs. 15% Then
Satisfaction with the way things are going in the United States has varied significantly over Obama's time in office so far and stood at 25% in late August. This is up from 15% in February 2009, which was slightly above this measure's all-time low of 7% recorded in October 2008 and quite negative on an absolute basis. Satisfaction rose to as high as 36% in the months after Obama took office (in August 2009) before settling back down into a range between 19% and 26% for most of 2010 and early 2011. Then, satisfaction fell sharply in the summer of 2011, reaching 11% in August and September, before climbing back to 28% in July of this year, and 23% in early August. The 28% July reading was the highest satisfaction had been since late August/early September 2009.
Thus, Americans are more satisfied now than when Obama took office, but if one compares this with some six months after Obama took office, satisfaction is down.
Satisfaction has averaged 37% since Gallup began measuring it periodically in 1979 and monthly in 2000. Satisfaction was higher at the comparable points when the last two presidents sought re-election, with a 41% reading in September 2004, and 45% in late August/early September 1996. By contrast, when George H.W. Bush ran for re-election in 1992, a late August/early September Gallup poll showed satisfaction at 22% -- lower than the historical average.
Standard of Living: 48% "Getting Better" Now vs. 35% Then
Nearly half of Americans (48%) in August said their standard of living is getting better, marking a significant improvement from 35% during Obama's first full month in office, and near the high for his term reached earlier this year. The "getting better" number in February 2009 is the lowest reading of his administration. The highest is 52%, reached in January, April, and May of this year.
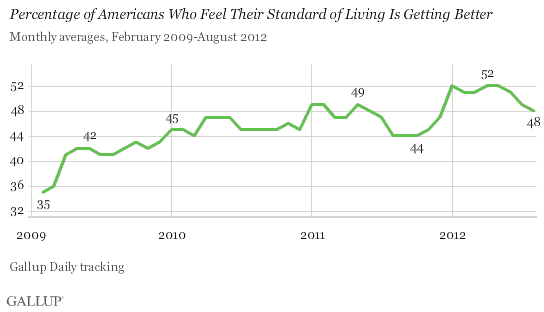
Gallup also tracks responses to a parallel question, "Are you satisfied or dissatisfied with your standard of living, all the things you can buy and do?" and finds that the generally positive responses are remarkably stable over time. Seventy-three percent were satisfied with their standard of living in August, compared with 72% in February 2009.
Job Creation Index: +19 Now vs. -5 Then
Gallup's Job Creation Index is one Gallup measure that has improved since Obama took office in a fairly straightforward, linear pattern, to +19 in August compared with -5 in February 2009.
The Job Creation Index is based on the percentage of workers who report that their company or place of employment is hiring new workers and expanding the size of its workforce, minus the percentage who say their company or place of employment is letting people go and reducing the size of its workforce. The index has steadily improved since Obama has been in office but has remained roughly at the same level since March of this year. The Job Creation Index stood at 26 in January 2008, the month in which Gallup began tracking it.
Obama Job Approval: 45% Now vs. 64% Then
Obama's 45% job approval rating in August is below his term average to date, 49%, and well below his initial ratings. Obama began his term with the high "honeymoon period" job approval ratings that most presidents initially enjoy. His monthly average for February 2009 was 64% and he reached a term-high monthly average of 65% in May 2009. His ratings began to fall after that point, and with one exception have generally been in the 40% range since. That exception came after the assassination of Osama bin Laden in May 2011, when Obama's monthly average reached 50%. His approval fell in the summer of 2011 along with most other measures during the "debt ceiling crisis," reaching his term-low monthly average of 41% in August, September, and October of that year.
Obama received a bounce in his job approval rating during and after the recent Democratic convention, reaching 50% for the week ending Sept. 9, but it is too early to tell if that increase will be sustained for the remainder of the month.
Bottom Line
Americans are clearly better off on several economic and mood measures now than they were in February 2009 when President Obama took office. However, the most substantial gains on these measures mainly occurred early in his administration, with trends mixed since then -- particularly the downturn on all measures in the late summer and early fall of 2011 during the debt ceiling crisis. Additionally, most of these measures were historically very low when Obama took office.
The two measures that show more straightforward gains during the Obama administration are the Job Creation Index, which has risen fairly steadily from a -5 when he took office to today's +19, and the standard of living measure, which has gone from 35% who say their standard of living is getting better to 48% today.
Obama's job approval rating, a key predictor of a president's re-election probabilities, was at 45% in August, below his term average of 49% and well below the 60%+ averages when he first took office in 2009. However, Obama's 50% job approval rating for the week of his party's just-finished convention suggests that September may be a better month for Obama than August.
Survey Methods
The analyses included in this report are based on trends included in both Gallup Daily tracking (economic confidence, standard of living, Job Creation, Obama job approval) and in separate monthly polls (satisfaction). Please refer to the linked stories for methodological statements relating to each measure.
Interviews are conducted with respondents on landline telephones and cellular phones, with interviews conducted in Spanish for respondents who are primarily Spanish-speaking. Each sample includes a minimum quota of 400 cell phone respondents and 600 landline respondents per 1,000 national adults, with additional minimum quotas among landline respondents by region. Landline telephone numbers are chosen at random among listed telephone numbers. Cell phone numbers are selected using random-digit-dial methods. Landline respondents are chosen at random within each household on the basis of which member had the most recent birthday.
Samples are weighted by gender, age, race, Hispanic ethnicity, education, region, adults in the household, and phone status (cell phone only/landline only/both, cell phone mostly, and having an unlisted landline number). Demographic weighting targets are based on the March 2011 Current Population Survey figures for the aged 18 and older non-institutionalized population living in U.S. telephone households. All reported margins of sampling error include the computed design effects for weighting and sample design.
In addition to sampling error, question wording and practical difficulties in conducting surveys can introduce error or bias into the findings of public opinion polls.
For more details on Gallup's polling methodology, visit www.gallup.com.
