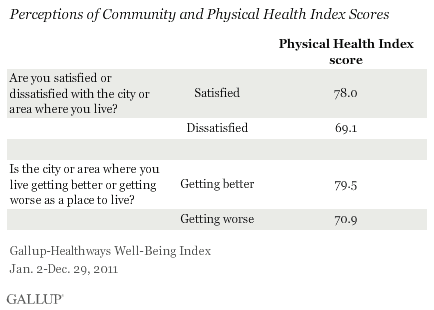
WASHINGTON, D.C. -- Americans who are either satisfied with their community or feel that their community is becoming a better place to live have Physical Health Index scores that are roughly nine points higher than score for Americans who are not satisfied with their communities or feel that their community is becoming a worse place to live.

Specifically, those who are satisfied with the city in which they live or feel that it is becoming a better place to live are less likely to report having experienced physical pain, having health problems, being obese, having headaches, or having ever been diagnosed with asthma or high cholesterol. They are also more likely to report feeling well-rested and having enough energy.
Additionally, adults who say their city is getting better as a place to live are less likely to report having ever been diagnosed with high blood pressure, diabetes, or high cholesterol than those who say their city is getting worse as a place to live. However, residents who are satisfied with their city are no less likely to report these three health issues than those who are dissatisfied.

Of note, these results hold true even when controlling for income, education, and ethnicity -- revealing that individuals' perceptions of their communities are important, regardless of their demographic or socioeconomic situation.
Gallup and Healthways ask 1,000 American adults daily about their physical health and community perceptions as part of the Gallup-Healthways Well-Being Index. The Physical Health Index includes 18 items, which measure: sick days in the past month, disease burden, health problems that get in the way of normal activities, obesity, feeling well-rested, daily energy, daily colds, daily flu, and daily headaches.
Community Safety Bolsters Physical Health
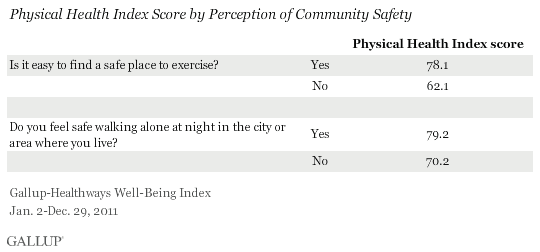
In addition, Gallup finds that Americans who feel safe while walking alone at night in the city or area where they live are in better physical health than those who do not feel safe doing so. Similarly, those who say they have easy access to a safe place to exercise in the city or area where they live are in better physical health than those who don't.

Support for an Ecological Model of Physical Health
Although income, education, and ethnicity are correlated with health outcomes, tapping into an individual's perceptions about where they live sheds light on community-level factors that may influence the physical health of Americans. While there may be other factors at play here, such as age, the data suggest that there is a relationship between community perceptions and health.
These findings provide support for the ecological model of health, which suggests that one's living conditions, community safety, community development, and civic engagement, among other factors, affect community members' health outcomes. The relationship between community-level perspectives and physical health may have significant implications for urban planning and community improvement efforts, particularly in light of the increase in cardiovascular disease and obesity over the past decade. According to a recent Gallup Business Journal article, U.S. cities with the highest rates of obesity spend approximately $50 million per 100,000 residents to cover the direct costs associated with obesity and related conditions, such as cardiovascular disease.
The American Heart Association suggests that costs to treat cardiovascular disease may triple by 2030. At the same time, the growing trend of childhood obesity will greatly increase the percentage of American adults with cardiovascular disease and related conditions in the coming decades. As policymakers consider solutions to end the epidemic of obesity and bring down its associated healthcare costs in the U.S., discussions about community infrastructure may become increasingly prevalent. Urban planners and local governments can help ensure residents in their cities are not only satisfied with their community, but also have safe places to engage in physical activities.
About the Gallup-Healthways Well-Being Index
The Gallup-Healthways Well-Being Index tracks well-being in the U.S., U.K., and Germany and provides best-in-class solutions for a healthier world. To learn more, please visit well-beingindex.com.
Survey Methods
Results are based on telephone interviews conducted as part of the Gallup Healthways Well-Being Index survey Jan. 2-Dec. 29, 2011, with a random sample of 353,492 adults, aged 18 and older, living in all 50 U.S. states and the District of Columbia.
For results based on the total sample of national adults, one can say with 95% confidence that the maximum margin of sampling error is ±1 percentage points.
Interviews are conducted with respondents on landline telephones and cellular phones, with interviews conducted in Spanish for respondents who are primarily Spanish-speaking. Each sample includes a minimum quota of 400 cell phone respondents and 600 landline respondents per 1,000 national adults, with additional minimum quotas among landline respondents by region. Landline telephone numbers are chosen at random among listed telephone numbers. Cell phones numbers are selected using random digit dial methods. Landline respondents are chosen at random within each household on the basis of which member had the most recent birthday.
Samples are weighted by gender, age, race, Hispanic ethnicity, education, region, adults in the household, and phone status (cell phone-only/landline only/both, cell phone mostly, and having an unlisted landline number). Demographic weighting targets are based on the March 2011 Current Population Survey figures for the aged 18 and older non-institutionalized population living in U.S. telephone households. All reported margins of sampling error include the computed design effects for weighting and sample design.
In addition to sampling error, question wording and practical difficulties in conducting surveys can introduce error or bias into the findings of public opinion polls.
For more details on Gallup's polling methodology, visit https://www.gallup.com/.
