###Embeddable###
###Embeddable###
###Embeddable###
###Embeddable###
###Embeddable###
###Embeddable###
###Embeddable###
###Embeddable###
###Embeddable###
###Embeddable###
###Embeddable###
###Embeddable###
###Embeddable###
###Embeddable###
###Embeddable###
###Embeddable###
###Embeddable###
###Embeddable###
###Embeddable###
###Embeddable###
###Embeddable###
###Embeddable###
###Embeddable###
Alcohol and Drinking > Occasion to Use Graph % Yes Jan 1 1939 58 Nov 23 1945 67 Jul 2 1946 67 Oct 3 1947 63 Dec 1 1949 58 Jun 4 1950 60 Aug 26 1951 59 Dec 11 1952 60 Jan 6 1956 60 Mar 15 1957 58 Jan 24 1958 55 Dec 10 1959 61 Mar 30 1960 62 Jan 1 1964 63 Jan 21 1966 65 Feb 22 1969 63 Jan 1 1969 64 May 10 1974 68 Jan 1 1976 71 Jan 14 1977 71 Apr 21 1978 71 Nov 10 1978 66 May 4 1979 69 Jan 9 1981 70 Aug 13 1982 65 Mar 11 1983 65 Jul 6 1984 64 Sep 6 1984 64 Feb 15 1985 67 Mar 14 1987 65 Apr 10 1987 63 Jul 10 1987 65 Mar 8 1988 62 Jul 1 1988 63 Apr 4 1989 62 Sep 12 1989 56 Dec 6 1990 57 Jan 16 1992 64 Jun 3 1994 65 Jun 27 1996 58 Jun 26 1997 61 Sep 23 1999 64 Nov 13 2000 64 Jul 19 2001 62 Jul 9 2002 66 Jul 7 2003 62 Jul 8 2004 62 Jul 7 2005 63 Jul 6 2006 64 Jul 12 2007 64 Jul 10 2008 62 Jun 14 2009 64 Jul 8 2010 67 Jul 7 2011 64 Jul 9 2012 66 Jul 10 2013 60 Jul 7 2014 64 Jul 8 2015 64 Jul 13 2016 65 Jul 5 2017 62 Jul 1 2018 63 Jul 1 2019 65 Jul 6 2021 60 Jul 5 2022 67 Jul 3 2023 62 Jul 1 2024 58 Jul 7 2025 54
Alcohol and Drinking > Cause Trouble Graph % Yes Jul 1 2024 25 Jul 3 2023 30 Jul 1 2019 36 Jul 1 2018 37 Jul 13 2016 33 Jul 8 2015 32 Jul 7 2014 36 Jul 10 2013 29 Jul 7 2011 30 Jul 8 2010 31 Jul 10 2008 30 Jul 12 2007 35 Jul 6 2006 29 Jul 7 2005 29 Jul 8 2004 37 Jul 7 2003 31 Jul 9 2002 28 Jul 19 2001 36 Nov 13 2000 36 Sep 23 1999 36 Jun 26 1997 30 Jun 27 1996 23 Jun 3 1994 27 Jan 16 1992 24 Dec 6 1990 23 Sep 12 1989 19 Mar 14 1987 24 Feb 15 1985 21 Jul 6 1984 18 Jan 1 1981 22 Jan 1 1978 22 Jan 1 1976 17 Jan 1 1975 12 Jan 1 1966 12 Jan 1 1947 15
Alcohol and Drinking > Occasion to Use Table Yes, drink No, do not % % 2025 Jul 7-21 54 44 2024 Jul 1-21 58 41 2023 Jul 3-27 62 38 2022 Jul 5-26 67 33 2021 Jul 6-21 60 39 2019 Jul 1-12 65 34 2018 Jul 1-11 63 36 2017 Jul 5-9 62 38 2016 Jul 13-17 65 35 2015 Jul 8-12 64 35 2014 Jul 7-10 64 36 2013 Jul 10-14 60 39 2012 Jul 9-12 66 34 2011 Jul 7-10 64 35 2010 Jul 8-11 67 33 2009 Jun 14-17 64 36 2008 Jul 10-13 62 38 2007 Jul 12-15 64 36 2006 Jul 6-9 64 36 2005 Jul 7-10 63 37 2004 Jul 8-11 62 38 2003 Jul 7-9 62 38 2002 Jul 9-11 66 34 2001 Jul 19-22 62 38 2000 Nov 13-15 64 36 1999 Sep 23-26 64 36 1997 Jun 26-29 61 39 1996 Jun 27-30 58 42 1994 Jun 3-6 65 35 1992 Jan 16-19 64 35 1990 Dec 6-9 57 43 1989 Sep 12-15 56 44 1989 Apr 4-9 62 38 1988 Jul 1-7 63 37 1988 Mar 8-12 62 38 1987 Jul 10-13 65 35 1987 Apr 10-13 63 37 1987 Mar 14-18 65 35 1985 Feb 15-18 67 33 1984 Sep 6-9 64 36 1984 Jul 6-9 64 36 1983 Mar 11-14 65 35 1982 Aug 13-16 65 35 1981 Jan 9-12 70 30 1979 May 4-7 69 31 1978 Nov 10-13 66 34 1978 Apr 21-24 71 29 1977 Jan 14-17 71 29 1976 71 29 1974 May 10-13 68 32 1969 Jan 1-6 64 36 1969 Feb 22-27 63 37 1966 Jan 21-26 65 35 1964 63 37 1960 Mar 30-Apr 4 62 38 1959 Dec 10-15 61 39 1958 Jan 24-29 55 45 1957 Mar 15-20 58 42 1956 Jan 6-11 60 40 1952 Dec 11-16 60 40 1951 Aug 26-31 59 41 1950 Jun 4-9 60 40 1949 Dec 1-6 58 42 1947 Oct 3-8 63 37 1946 Jul 26-31 67 33 1945 Nov 23-28 67 33 1939 58 42
Alcohol and Drinking > Drinking Cause Trouble Table Yes, has No, has not No opinion % % % 2024 Jul 1-21 25 74 1 2023 Jul 3-27 30 70 * 2019 Jul 1-12 36 64 * 2018 Jul 1-11 37 63 -- 2016 Jul 13-17 33 67 * 2015 Jul 8-12 32 67 * 2014 Jul 7-10 36 64 1 2013 Jul 10-14 29 71 * 2011 Jul 7-10 30 70 * 2010 Jul 8-11 31 68 * 2008 Jul 10-13 30 70 * 2007 Jul 12-15 35 65 * 2006 Jul 6-9 29 71 * 2005 Jul 7-10 29 71 * 2004 Jul 8-11 37 63 -- 2003 Jul 7-9 31 69 * 2002 Jul 9-11 28 72 * 2001 Jul 19-22 36 64 * 2000 Nov 13-15 36 64 * 1999 Sep 23-26 36 64 * 1997 Jun 26-29 30 70 * 1996 Jun 27-30 23 77 * 1994 Jun 3-6 27 72 1 1992 Jan 16-19 24 76 -- 1990 Dec 6-9 23 76 1 1989 Sep 12-15 19 81 -- 1987 Mar 14-18 24 76 -- 1985 Feb 15-18 21 79 -- 1984 Jul 6-9 18 82 -- 1981 22 78 -- 1978 22 78 -- 1976 17 83 -- 1974 12 88 -- 1966 12 88 -- 1947 15 85 --
Alcohol and Drinking > When Last Drink Table Within last 24 hours Over one day to one week ago Over one week ago No opinion % % % % 2025 Jul 7-21 24 34 40 1 2024 Jul 1-21 28 33 38 1 2023 Jul 3-27 32 37 32 * 2022 Jul 5-26 30 36 33 * 2021 Jul 6-21 34 33 33 * 2019 Jul 1-12 29 40 30 1 2018 Jul 1-11 39 29 31 * 2017 Jul 5-9 37 32 31 * 2016 Jul 13-17 40 27 33 1 2015 Jul 8-12 35 32 33 1 2014 Jul 7-10 27 40 33 * 2013 Jul 10-14 35 29 35 1 2012 Jul 9-12 31 36 32 * 2011 Jul 7-10 32 36 32 * 2010 Jul 8-11 37 31 31 1 2009 Jun 14-17 40 26 34 * 2008 Jul 10-13 36 32 32 1 2007 Jul 12-15 36 29 36 * 2006 Jul 6-9 36 35 29 * 2005 Jul 7-10 36 31 32 1 2004 Jul 8-11 33 38 29 * 2003 Jul 7-9 31 40 29 * 2002 Jul 9-11 28 38 34 * 2001 Jul 19-22 30 32 38 * 2000 Nov 13-15 26 32 42 * 1999 Sep 23-26 35 25 39 1 1997 Jun 26-29 33 25 42 * 1996 Jun 27-30 28 26 45 1 1994 Jun 3-6 34 23 42 1 1992 Jan 16-19 26 24 49 1 1990 Dec 6-9 29 23 47 1 1989 Sep 12-15 32 35 32 1 1988 Jul 1-7 39 25 34 2 1987 Jul 10-13 38 30 31 1 1984 Jul 6-9 39 29 31 1
Alcohol and Drinking > How Many Drinks Table None 1-7 8-19 20+ No opinion Mean Median % % % % % # # 2025 Jul 7-21 41 48 7 2 2 2.8 1 2024 Jul 1-21 39 48 9 3 1 3.8 1 2023 Jul 3-27 33 55 8 4 1 4 2 2022 Jul 5-26 34 53 8 4 1 3.9 2 2021 Jul 6-21 34 52 10 3 * 3.6 2 2019 Jul 1-12 31 55 9 4 2 4 2 2018 Jul 1-11 33 54 9 4 1 3.9 2 2017 Jul 5-9 32 51 9 5 2 4.1 2 2016 Jul 13-17 35 50 9 3 2 3.9 2 2015 Jul 8-12 35 50 10 4 1 4.5 2 2014 Jul 7-10 35 50 9 5 1 4.1 2 2013 Jul 10-14 37 48 9 4 2 3.8 1 2012 Jul 9-12 34 52 7 5 1 4.2 2 2011 Jul 7-10 33 54 8 4 1 4.1 2 2010 Jul 8-11 34 51 9 4 1 4.4 2 2009 Jun 14-17 34 51 9 5 2 4.8 2 2008 Jul 10-13 34 53 9 3 2 3.8 2 2007 Jul 12-15 37 48 9 5 1 4.8 2 2006 Jul 6-9 30 53 11 5 * 4.5 2 2005 Jul 7-10 34 49 11 5 1 4.3 2 2004 Jul 8-11 31 55 8 5 1 4.9 2 2003 Jul 7-9 30 50 12 6 2 5.1 2 2002 Jul 9-11 34 50 9 5 2 4.4 2 2001 Jul 19-22 39 48 9 4 * 3.4 1 2000 Nov 13-15 43 46 8 3 * 3.3 1 1999 Sep 23-26 40 47 8 4 * 3.7 2 1997 Jun 26-29 41 45 8 5 1 3.6 1 1996 Jun 27-30 47 42 7 2 2 2.8 1 1994 Jun 3-6 44 42 10 3 1 -- -- 1992 Jan 16-19 51 36 10 2 1 -- -- 1990 Dec 6-9 50 40 6 3 1 -- -- 1989 Sep 12-15 33 47 13 5 2 -- -- 1988 Jul 1-7 32 49 10 6 3 -- -- 1987 Jul 10-13 29 50 11 6 4 -- --
Alcohol and Drinking > Liquor Wine or Beer Table Beer Wine Liquor All/Same (vol.) Other (vol.) No opinion % % % % % % 2025 Jul 7-21 38 29 30 2 * 1 2024 Jul 1-21 34 33 29 4 * 1 2023 Jul 3-27 37 29 31 1 * 1 2022 Jul 5-26 35 31 30 2 * 1 2021 Jul 6-21 39 31 27 3 * * 2019 Jul 1-12 38 30 29 2 * 1 2018 Jul 1-11 42 34 19 4 * 1 2017 Jul 5-9 40 30 26 3 1 * 2016 Jul 13-17 43 32 20 3 1 1 2015 Jul 8-12 42 34 21 3 * * 2014 Jul 7-10 41 31 23 3 * 1 2013 Jul 10-14 36 35 23 3 1 2 2012 Jul 9-12 39 35 22 3 * 1 2011 Jul 7-10 36 35 23 4 1 1 2010 Jul 8-11 41 32 21 4 * 1 2009 Jun 14-17 40 34 21 5 -- 1 2008 Jul 10-13 42 31 23 4 * * 2007 Jul 12-15 40 34 22 4 * * 2006 Jul 6-9 41 33 23 3 -- * 2005 Jul 7-10 36 39 21 3 * 1 2004 Jul 8-11 39 33 24 4 * * 2003 Jul 7-9 42 33 22 3 * * 2002 Jul 9-11 44 30 22 3 1 * 2001 Jul 19-22 46 31 18 4 * 1 2000 Nov 13-15 43 31 22 3 0 1 1999 Sep 23-26 42 34 19 4 * 1 1997 Jun 26-29 45 32 18 4 * 1 1996 Jul 25-28 46 27 20 6 0 1 1994 Jun 3-6 47 29 18 3 1 2 1992 Jan 16-19 47 27 21 3 1 1
Alcohol and Drinking > Drinking Moderate Good for Health Table Good for health Makes no difference Bad for health No opinion % % % % 2025 Jul 7-21 6 37 53 3 2024 Jul 1-21 8 43 45 3 2023 Jul 3-27 10 50 39 1 2018 Jul 1-11 16 55 28 2 2016 Jul 13-17 19 51 26 3 2015 Jul 8-12 17 52 28 2 2011 Jul 7-10 22 50 25 3 2007 Jul 12-15 22 49 25 4 2005 Jul 7-10 25 51 22 2 2003 Jul 7-9 24 49 25 2 2001 Jul 19-22 22 46 27 5
Alcohol and Drinking > How Often Drink Table Every day Few times a week Once a week Less than once a week Special occasions Never No opinion % % % % % % % 2024 Nov 6-20 6 13 13 11 26 31 * 2023 Nov 1-23 5 13 10 9 33 30 * 2007 Nov 11-14 7 13 10 9 29 33 * 2006 Nov 9-12 10 13 11 9 27 30 * 2005 Nov 7-10 5 14 11 10 29 31 * 2004 Nov 7-10 7 13 13 10 25 32 * 2003 Nov 3-5 7 16 13 12 25 27 * 2001 Nov 8-11 7 12 13 14 24 30 *
Alcohol and Drinking > Drinking More Than You Should Table Yes No No opinion % % % 2024 Jul 1-21 16 84 * 2023 Jul 3-27 19 81 -- 2021 Jul 6-21 18 82 * 2019 Jul 1-12 18 82 * 2018 Jul 1-11 19 80 * 2016 Jul 13-17 25 75 * 2015 Jul 8-12 24 75 * 2014 Jul 7-10 18 81 * 2013 Jul 10-14 21 78 * 2012 Jul 9-12 22 78 * 2011 Jul 7-10 17 83 * 2010 Jul 8-11 23 77 * 2008 Jul 10-13 23 77 -- 2007 Jul 12-15 22 77 * 2006 Jul 6-9 22 78 * 2005 Jul 7-10 21 79 -- 2004 Jul 8-11 25 75 * 2003 Jul 7-9 24 76 * 2002 Jul 9-11 21 79 * 2001 Jul 19-22 20 80 * 2000 Nov 13-15 26 74 * 1999 Sep 23-26 24 76 * 1997 Jun 26-29 22 78 * 1996 Jul 25-28 25 75 * 1994 Jun 3-6 29 71 -- 1992 Jan 16-19 29 71 -- 1990 Dec 6-9 23 76 1 1989 Sep 12-15 35 65 -- 1987 Jul 1-7 29 71 -- 1985 Feb 15-18 32 68 -- 1978 Nov 10-13 23 77 --
Alcohol and Drinking > Worry Long Term Effect Table Great deal Fair amount Not much Not at all No opinion % % % % % 2024 Jul 1-21 5 11 33 51 *
Alcohol and Drinking > Heard About Recent Studies Long Term Effects Table Great deal Fair amount Not much Nothing No opinion % % % % % 2024 Jul 1-21 19 30 30 21 *
Alcohol and Drinking > Advice for Average Drinker Table Stop drinking altogether Reduce the amount Not change habits No opinion % % % % 2024 Jul 1-21 22 55 17 6
Alcohol and Drinking > How Harmful Products Table Very harmful Somewhat harmful Not too harmful Not at all harmful Depends (vol.) No opinion % % % % % % Cigarettes 2024 Jul 1-21 79 18 1 1 * * 2023 Jul 3-27 76 19 3 1 * * A pipe 2024 Jul 1-21 44 40 7 3 2 5 2023 Jul 3-27 39 42 11 5 1 3 Cigars 2024 Jul 1-21 45 39 9 4 * 2 2023 Jul 3-27 39 41 15 3 * 1 Chewing tobacco 2024 Jul 1-21 61 31 3 2 * 3 2023 Jul 3-27 58 31 7 2 * 1 E-cigarettes, also known as “vaping” 2024 Jul 1-21 57 34 4 1 * 4 2023 Jul 3-27 54 36 8 1 * 2 Marijuana 2024 Jul 1-21 26 40 22 10 * 2 2023 Jul 3-27 23 35 25 15 1 * Alcohol 2024 Jul 1-21 33 53 8 2 2 1 2023 Jul 3-27 30 50 14 2 4 * Nicotine pouches 2024 Jul 1-21 34 38 10 7 * 11
Alcohol and Drinking > Reasons Don't Drink Table 1978 Apr 21-24 2023 Jul 3-27 % % No reason/Don’t want it/Have no desire 13 24 Don’t like/Don’t care for it 36 16 Unhealthful/Not good for your body 16 14 Afraid of the consequences 7 13 Bad past experience with alcohol 7 13 Unable to drink due to bad health 6 11 Against my religious beliefs 9 10 My age -- 4 Too expensive/Costly 5 3 I have children 1 2 Wrong/Don’t Believe in it/Don’t approve 10 1 Was not raised to drink 3 1 Causes trouble/Destroys families 4 * Other 1 4 No opinion 5 *
Alcohol and Drinking > Effect on Drinkers and Society Table Very positive Somewhat positive Somewhat negative Very negative No opinion % % % % % … most people who drink? 3 24 52 19 2 … society? 2 21 55 20 1
Alcohol and Drinking > Drinking Morally Acceptable Table Morally acceptable Morally wrong Depends (vol.) Not a moral issue (vol.) No opinion % % % % % 2020 May 1-13 86 12 1 * * 2019 May 1-12 79 19 1 * * 2018 May 1-10 ^ 78 19 3 * *
Alcohol and Drinking > How Often Worry About Drinking Table All of the time Some of the time Not too often Never No opinion % % % % % 2019 Jul 1-12 1 4 14 81 *
Alcohol and Drinking > Lower Drinking Age Table Favor Oppose No opinion % % % 2014 Jul 7-10 25 74 1 2007 Jul 12-15 ^ 22 77 1 2001 Jul 19-22 ^ 21 77 2
Alcohol and Drinking > How Many Family Friends Drink Table Many Some Only a few None No opinion % % % % % 2013 Jul 10-14 23 28 36 12 1
Alcohol and Drinking > Drinking Problem to Society Table Extremely serious Very serious Somewhat serious Not serious No opinion % % % % % 2012 Jul 9-12 ^ 18 29 39 12 2 2005 Jul 7-10 21 32 40 7 * 2003 Jul 7-9 17 29 44 9 1
Alcohol and Drinking > Drinking Federal Government Programs Table Extremely important Very important Somewhat important Not important No opinion % % % % % 2012 Jul 9-12 ^ 21 34 25 19 2
Alcohol and Drinking > Penalties Underage Drinking Table More strict Less strict Remain as now No opinion % % % % 2007 Jul 12-15 ^ 60 6 31 3 2001 Jul 19-22 ^ 60 6 33 1
Recommended
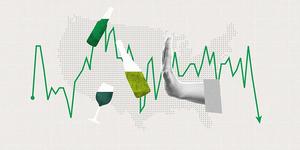
A record-low 54% of Americans say they drink alcohol, as a majority now believe moderate drinking is unhealthy.
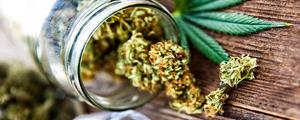
Slim majorities of Americans think marijuana has a negative effect on society and on most people who use it, yet it is viewed as less harmful than seven other substances.
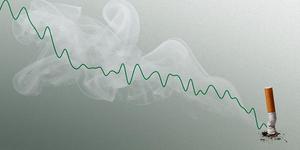
Eleven percent of Americans smoke cigarettes, tying the low in Gallup's 80-year trend.
Keep up with how Americans react to the Trump administration and how society evolves with key Gallup trends.
Gallup https://news.gallup.com/poll/1582/Alcohol-Drinking.aspx Gallup World Headquarters, 901 F Street, Washington, D.C., 20001, U.S.A