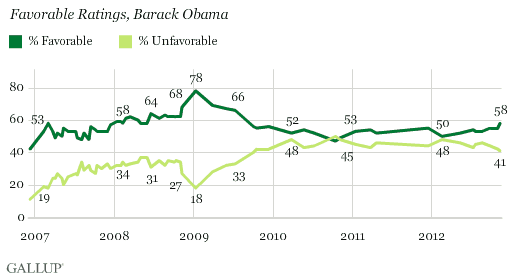
PRINCETON, NJ -- Now that the presidential election is over, Americans look a bit more positively toward both the winner (Barack Obama) and the loser (Mitt Romney) than they did in the final days leading up to the election. Americans' views of the Democratic Party are up significantly, while their views of the Republican Party are unchanged.
The results are based on a Nov. 9-12 USA Today/Gallup poll. The pre-election measures for Obama and Romney are based on a Nov. 1-2 USA Today/Gallup poll, conducted a few days before Election Day. The pre-election measures for the political parties are based on an Aug. 20-22 USA Today/Gallup poll, conducted just before the party conventions.
Obama's current 58% favorable rating represents his best in over three years, since a 66% reading in July 2009. He was more popular after his first election than he is now, with a 68% favorable rating just after the November 2008 election. His all-time high of 78% was measured shortly before his inauguration as president in January 2009.
Romney's current 50% rating ties his personal high from May, shortly after he clinched the 2012 Republican presidential nomination. During most of the campaign, though, Americans' views of Romney were generally mixed, with about as many having a negative as a positive opinion of him.
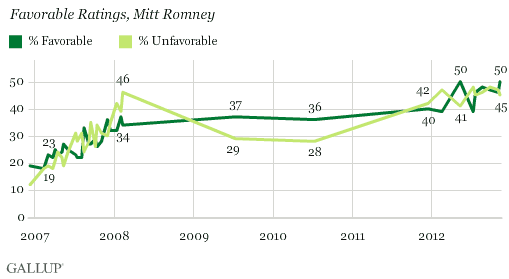
Gallup also saw increases in favorable ratings of the presidential candidates after the 2008 election, with Obama's favorable increasing to 68% from 62% and John McCain's to 64% from 50%. Gallup did not measure post-election favorability ratings of both candidates in prior election years.
Majority of Americans Now Have Positive View of Democratic Party
For the first time since the late summer of 2009, a majority of Americans have a positive opinion of the Democratic Party. Views of the party had generally been more positive than negative in 2009 and before, but more negative than positive in 2010 and 2011.
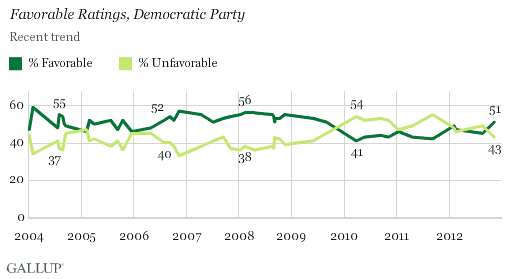
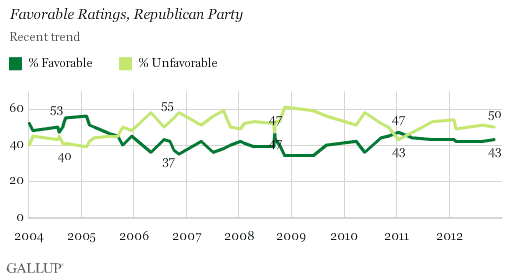
Meanwhile, Americans' opinions of the Republican Party remain more negative than positive, with 43% having a favorable and 50% an unfavorable view of the GOP.
Americans have been negative on balance toward the Republican Party since late 2005 -- apart from 2008, after the party's convention nominated John McCain and Sarah Palin as its presidential and vice presidential candidates, and January 2011, shortly after the new Republican majority in the House of Representatives took office.
Implications
Americans view both 2012 presidential candidates more positively now that the campaign is over, as Obama turns his attention to governing for the next four years and Romney to a future role outside of presidential politics. Obama now enjoys as positive an image in the eyes of Americans as he has at any point in the last three years.
Meanwhile, Americans continue to look more negatively than positively on the Republican Party, presenting a challenge for the party in terms of getting the public to back its priorities and to vote for it in elections, particularly when Americans view the Democratic Party much more positively.
Survey Methods
Results for this USA Today/Gallup poll are based on telephone interviews conducted Nov. 9-12, 2012, with a random sample of 1,009 adults, aged 18 and older, living in all 50 U.S. states and the District of Columbia.
For results based on the total sample of national adults, one can say with 95% confidence that the maximum margin of sampling error is ±4 percentage points.
Interviews are conducted with respondents on landline telephones and cellular phones, with interviews conducted in Spanish for respondents who are primarily Spanish-speaking. Each sample includes a minimum quota of 400 cellphone respondents and 600 landline respondents per 1,000 national adults, with additional minimum quotas among landline respondents by region. Landline telephone numbers are chosen at random among listed telephone numbers. Cellphone numbers are selected using random-digit-dial methods. Landline respondents are chosen at random within each household on the basis of which member had the most recent birthday.
Samples are weighted by gender, age, race, Hispanic ethnicity, education, region, adults in the household, population density, and phone status (cellphone only/landline only/both, cellphone mostly, and having an unlisted landline number). Demographic weighting targets are based on the March 2011 Current Population Survey figures for the aged 18 and older population living in U.S. All reported margins of sampling error include the computed design effects for weighting.
In addition to sampling error, question wording and practical difficulties in conducting surveys can introduce error or bias into the findings of public opinion polls.
View methodology, full question results, and trend data.
For more details on Gallup's polling methodology, visit www.gallup.com.
