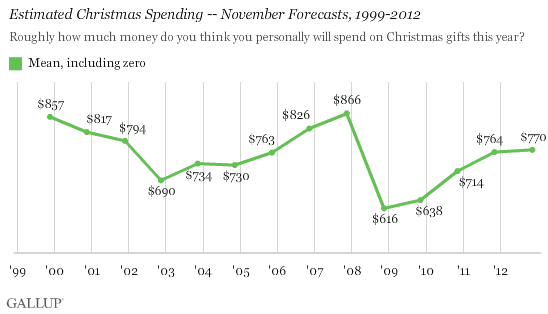
PRINCETON, NJ -- U.S. consumers predict they will spend an average of $770 on Christmas gifts this year. That roughly matches the $764 they estimated at this time a year ago amid a fairly robust holiday shopping season, thus pointing to good, though not great, sales for holiday retailers in 2012.

The Nov. 15-18 estimate is based on a Gallup poll with 1,015 national adults. Until now, consumers' November Christmas spending forecasts had increased each year since 2008, when their spending intentions had plummeted to a two-decade low.
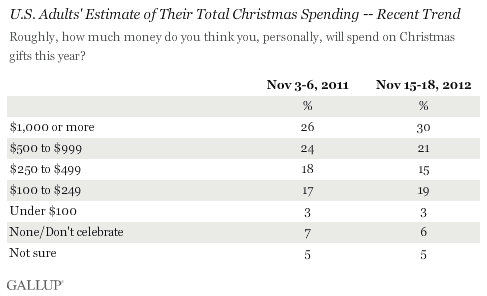
Nearly nine in 10 respondents say they will spend some amount of money on Christmas gifts, including 30% who will spend $1,000 or more, slightly more than in 2011. At the same time, 6% say they will not spend any amount, and another 5% are unsure what they will spend.

Trends Point to Modest Growth in Holiday Sales
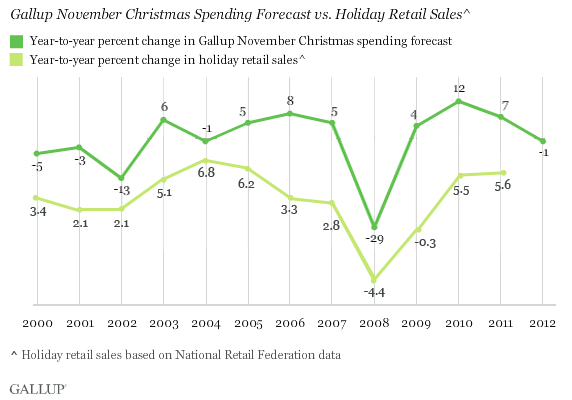
Gallup estimates that holiday retail sales will increase by between 3.5% and 3.7% in 2012 compared with 2011. This projection reflects the conflicting findings that consumers' Christmas spending forecast is essentially flat this year but is holding at a fairly high level in the context of the past five years.
A 3.5% to 3.7% increase in holiday shopping this year over 2011 would represent a less robust holiday retail season than the past two years -- when spending rose by 5.5% and 5.6% -- but would roughly match the 3.5% average for the past decade.
Gallup's holiday sales prediction is based on modeling of the historical relationship between Gallup's Christmas spending estimate and actual holiday retail sales (as calculated by the National Retail Federation). Annual changes in Gallup's November Christmas spending forecast over the past decade have largely paralleled changes in holiday sales.
- In years when Americans' Christmas spending forecast was lower than the previous year's forecast -- as in 2000, 2001, and 2002 -- holiday retail sales grew at relatively weak rates, between 2.1% and 3.4%.
- Punctuating this pattern, Gallup's unprecedented 29% year-over-year decrease in projected spending in 2008 coincided with a 4.4% decline in holiday sales that year -- one of the worst holiday retail seasons in recent memory.
- By contrast, in several years when consumers' projected holiday spending was up and registered moderately high levels -- in 2003, 2004, 2005, and 2011-- actual retail sales growth was fairly strong, ranging from 4.7% to 5.9%.
- In 2009, when consumers' estimated Christmas spending was up slightly but at a low level ($638), the annual change in holiday sales was accordingly low, at 0.3%.
- In November 2010, Americans' spending intentions increased by 12% over November 2009 -- the largest year-over-year increase Gallup had seen in more than a decade. Actual retail sales increased that year by 5.5%, the highest in several years.
- 2006 and 2007 were exception years when Gallup showed moderate increases in consumers' Christmas spending intentions, but sales growth was lackluster. 2004 presents a different exception -- that of a slight decline in spending intentions but a substantial increase (6.8%) in actual spending.

Recent Spending Also Points to Smaller Retail Gains
A key indicator of how consumers will spend at Christmas is how they spent in the months leading up to the holiday season. While major events -- such as the 9/11 attacks and 2008 financial collapse -- can intervene and disrupt these patterns, past performance is, in fact, a strong indicator of future returns when it comes to certain types of retail spending.
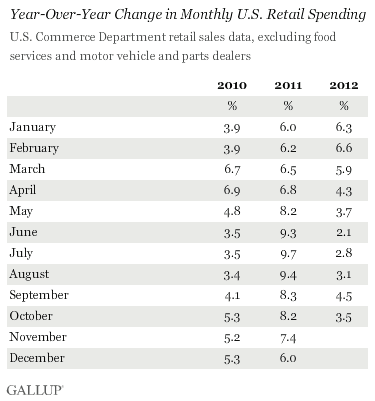
According to the U.S. government's measure of retail sales -- excluding expenditures on food, services, motor vehicles, and motor vehicle parts -- growth in monthly consumer spending since March has been running significantly behind 2011 growth levels.
Most recently, the 3.5% year-over-year increase in spending seen in October not only lagged behind 2011's 8.2% increase, but also trailed 2010's 5.3% increase. How much of October's softness was the result of Superstorm Sandy versus a broader weakening of consumer demand is an open question that will not be clarified until November's data are released next month.

Implications
The nation's retailers typically need a strong Christmas shopping season to help them meet their revenue goals, and, in terms of the planning that goes into inventory and hiring, it is always better to be prepared for a slow year than unpleasantly surprised by one. Thus, while 2012 does not appear poised to be a blockbuster, the good news is it does not appear to be harboring any unpleasant surprises either. According to the Commerce Department, consumer spending in 2012 has been up each month over 2011 levels, but by modest amounts at best, and it looks like holiday shopping will maintain that pattern, providing a 3.5% to 3.7% increase in sales.
One significant caveat involves the so-called "fiscal cliff." Unless and until the nation's leaders announce a budget compromise to avert the major spending cuts and tax increases set to take effect Jan. 1, consumers may be more cautious than is anticipated about their spending. Indeed, Gallup Daily tracking finds that U.S. economic confidence has weakened since the election, possibly reflecting some public concern about the fiscal cliff negotiations. Similarly, the sooner an announcement comes that U.S. leaders have reached a deal, the more time there would be for relieved consumers to head back to the mall.
Survey Methods
Results for this Gallup poll are based on telephone interviews conducted Nov. 15-18, 2012, with a random sample of 1,015 adults, aged 18 and older, living in all 50 U.S. states and the District of Columbia.
For results based on the total sample of national adults, one can say with 95% confidence that the maximum margin of sampling error is ±3 percentage points.
Interviews are conducted with respondents on landline telephones and cellular phones, with interviews conducted in Spanish for respondents who are primarily Spanish-speaking. Each sample includes a minimum quota of 400 cellphone respondents and 600 landline respondents per 1,000 national adults, with additional minimum quotas among landline respondents by region. Landline telephone numbers are chosen at random among listed telephone numbers. Cellphone numbers are selected using random-digit-dial methods. Landline respondents are chosen at random within each household on the basis of which member had the most recent birthday.
Samples are weighted by gender, age, race, Hispanic ethnicity, education, region, adults in the household, population density, and phone status (cellphone only/landline only/both, cellphone mostly, and having an unlisted landline number). Demographic weighting targets are based on the March 2011 Current Population Survey figures for the aged 18 and older population living in U.S. All reported margins of sampling error include the computed design effects for weighting.
In addition to sampling error, question wording and practical difficulties in conducting surveys can introduce error or bias into the findings of public opinion polls.
View methodology, full question results, and trend data.
For more details on Gallup's polling methodology, visit https://www.gallup.com/.
