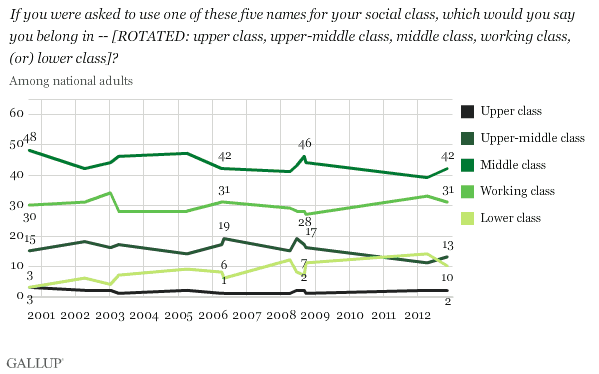
WASHINGTON, D.C. -- Americans are most likely to identify themselves as middle class, a trend that has remained essentially unchanged throughout the past decade. Another 31% identify as "working class" and 13% see themselves as "upper-middle class." Ten percent say they are "lower class," a slight decrease from 14% in April. Two percent identify themselves as upper class.

These findings are from a Nov. 9-12 USA Today/Gallup poll. While no official definition or metric determines membership in the middle class, President Barack Obama, like many politicians, frequently uses the term in his public pronouncements, including his recent description of his re-election victory as "a mandate to help middle-class families and families that are working hard to try to get into the middle class."
Using a broader definition of middle class to include "upper-middle class" and middle class, these data suggest most Americans feel they have ascended into this status. And if one includes "working class" in an even broader definition of this group, it encompasses more than three-quarters of all Americans.
Republicans More Likely to Say They Are Middle Class
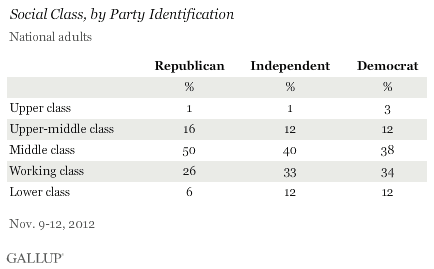
Opponents often criticize the Republican Party for caring only about the rich, but according to Gallup's poll, most Republicans see themselves as either middle class (50%) or upper-middle class (16%). Thirty-two percent affiliate with the working class, while 1% perceives themselves as upper class.
Democrats, by contrast, have long associated their party with representing the working class or "the common man," and rank-and-file Democrats are more likely than Republicans to claim membership to either the working class (34%) or the lower class (12%). Democrats are much less likely than Republicans to view themselves as middle class.
Independents' social class identification closely mirrors that of Democrats, perhaps indicative of the slight Democratic tilt in the most recent election.

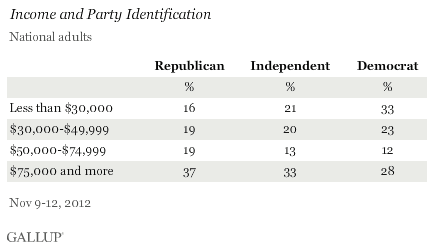
Even though no certain income level assures middle-class status, Republicans are more likely to earn more than Democrats or independents, which could help explain why more GOP sympathizers believe themselves to be middle class relative to the other political affiliations. Fifty-six percent of Republicans say they earn $50,000 or more per year, compared with 46% of independents and 40% of Democrats who say the same. On the other end of the income spectrum, Democrats are far more likely than the other two political affiliations to say they earn less than $30,000.

College Education May Not Be the Ticket to Middle Class
Many analysts agree that a college education is a critical factor in determining if an individual can reach the ranks of middle class or higher. To that point, an overwhelming percentage of individuals -- 71% -- with at least a college degree see themselves as middle class or upper-middle class, and another 4% say they are upper class. By comparison, 58% of adults with some college education -- but not a college degree -- and 42% with a high school diploma or less feel they belong to the middle class or upper-middle class.
In recent years, the percentage of Americans with at least a college degree identifying themselves as upper-middle or middle class has steadily declined, particularly compared with the years prior to the 2007-2009 Great Recession. The 71% who do so now is the lowest on record. In June of 2008 -- only months before the stock market would plummet as a result of a bevy of financial firms declaring bankruptcy or needing government assistance -- 83% of those with a college degree said they belonged to the broader middle class. A smaller 14% identified with the working and lower class.

The 58% of Americans with some college education (but no degree) who now say they belong to the upper-middle or middle class is up from 48% in April.
Implications
The percentage of Americans who see themselves as middle class or upper-middle class remains relatively stable. The social class that has shown the most growth over the past 10 years has been the lower class, a likely consequence of the tough economic times experienced these past few years. Interestingly, despite Americans' general approval of having a rich class and a widespread desire to become rich, few self-identify as being upper class, even in times of robust economic expansion.
These data help explain why politicians give the middle class such importance: A durable plurality of Americans believe themselves to be a part of it, and a majority says they are a part of the broader middle class.
How to become or stay in the middle class is a different matter, and of course, there is no universal formula. Broad agreement, though, focuses on the importance of obtaining a college degree -- something Americans have been doing at record levels. One concerning trend is that fewer Americans with a college degree identify with the middle class, and in fact, the percentage of college-educated Americans now judging themselves to be a part of the middle class is down significantly from before the recession. This may be a result of declining job opportunities, ballooning student debt that diminishes future living standards, or both. Whatever the cause, it could mean fewer college-educated Americans believing they are a part of the middle class.
Survey Methods
Results for this USA Today/Gallup poll are based on telephone interviews conducted Nov. 9-11, 2012, on the Gallup Daily tracking survey, with a random sample of 1,009 adults, aged 18 and older, living in all 50 U.S. states and the District of Columbia.
For results based on the total sample of national adults, one can say with 95% confidence that the maximum margin of sampling error is ±4 percentage points.
Interviews are conducted with respondents on landline telephones and cellular phones, with interviews conducted in Spanish for respondents who are primarily Spanish-speaking. Each sample includes a minimum quota of 400 cellphone respondents and 600 landline respondents per 1,000 national adults, with additional minimum quotas among landline respondents by region. Landline telephone numbers are chosen at random among listed telephone numbers. Cellphone numbers are selected using random-digit-dial methods. Landline respondents are chosen at random within each household on the basis of which member had the most recent birthday.
Samples are weighted by gender, age, race, Hispanic ethnicity, education, region, adults in the household, population density, and phone status (cellphone only/landline only/both, cellphone mostly, and having an unlisted landline number). Demographic weighting targets are based on the March 2011 Current Population Survey figures for the aged 18 and older population living in U.S. All reported margins of sampling error include the computed design effects for weighting.
In addition to sampling error, question wording and practical difficulties in conducting surveys can introduce error or bias into the findings of public opinion polls.
View methodology, full question results, and trend data.
For more details on Gallup's polling methodology, visit https://www.gallup.com/.
