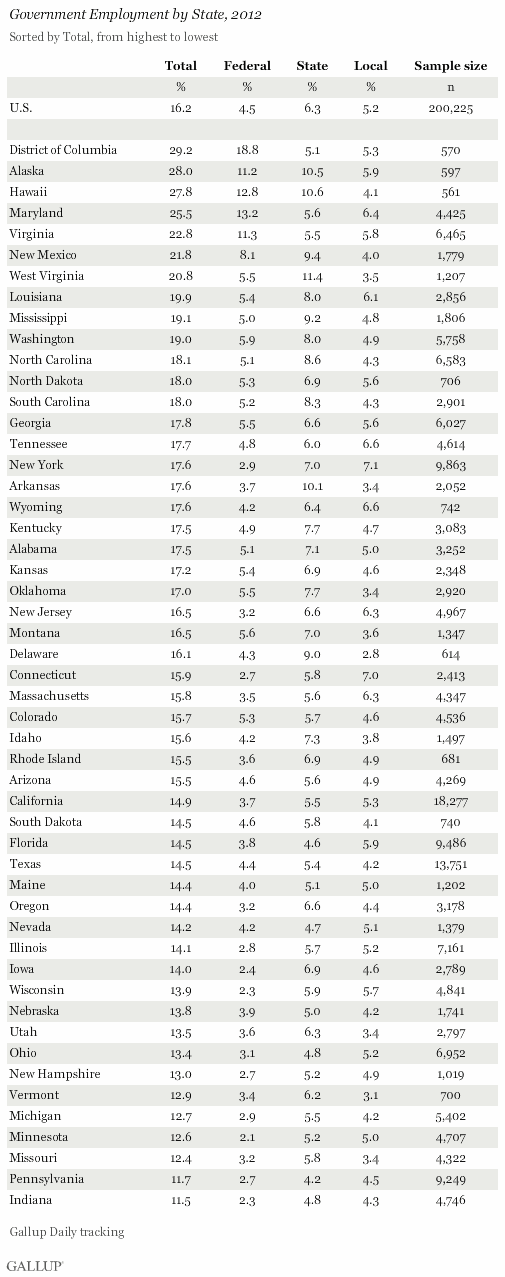
PRINCETON, NJ -- Nearly three in 10 employed adults living in the District of Columbia in 2012 worked for the federal government, a state government, or a local government. The 29.2% government employment rate in the nation's capital was higher than that in any of the 50 states. Alaska and Hawaii ranked second and third, respectively, with about 28% of each state's workers employed by government. Indiana and Pennsylvania had the lowest percentages of government employees, at just under 12%.
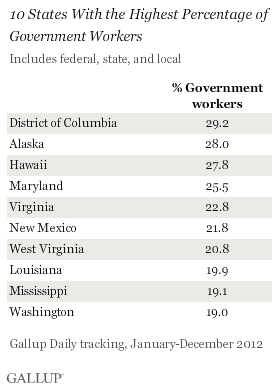
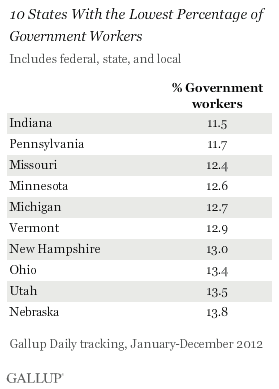
There is a much smaller range in government employment rates in the bottom 10 states (roughly two percentage points) than in the top 10 (roughly 10 points), largely owing to the high rates of government employment in a few states, namely Alaska and Hawaii, as well as in Washington, D.C., and its two neighboring states: Maryland and Virginia.
These results are based on the reports of 200,225 U.S. adult workers surveyed as part of Gallup Daily tracking between January and December 2012. The state-by-state rates represent annual averages of workers' reports of their current employment by the federal, state, or local government at the time they were interviewed. They are not cumulative rates reflecting the percentage employed by the government for any period of time throughout the year.
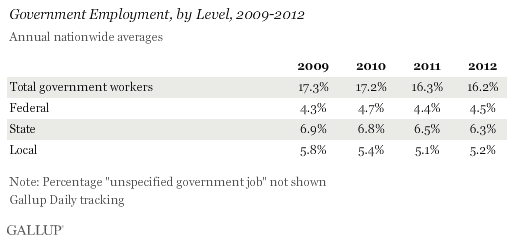
The average rate of workers employed by the government, nationally, in 2012 was 16.2%, similar to the 16.3% found in 2011, but significantly lower than the 17.2% in 2010 and 17.3% in 2009.
In addition to the Washington, D.C./Maryland/Virginia cluster, the states with the highest levels of government workers tend to be located in the South and West. Those with the lowest levels are found mainly in the Northeast and Midwest.
Few Shifts in 2012 Rankings
Of the 10 states with the highest percentage of government workers in 2012, the top seven plus Mississippi were also in the top 10 in 2011, with only a minor change in order at the top of the list. In 2011, Hawaii ranked first, followed by Alaska and then the District of Columbia. Washington, D.C., leapfrogged to the top of the list in 2012 by virtue of reported government employment dipping in Alaska and Hawaii, while it held steady in the nation's capital. Louisiana and Washington moved into the top 10 in 2012 with slight increases in government employment, edging out 2011 top 10 states South Carolina and Wyoming, which saw declines.
Eight of the 10 states with the lowest percentage of government workers are repeats from 2011, including the top six, plus New Hampshire and Ohio. Utah and Nebraska are new, replacing Maine and Oregon.
State and Local Workers Still Outnumber Federal Workers
Of the 16.2% of U.S. workers employed by government in 2012, the largest segment, 6.3%, is employed by state governments. This is followed by local government workers, at 5.2%, and then federal workers, at 4.5%. All of these rates were essentially unchanged in 2012 compared with 2011.
Longer term, the percentage of workers employed by the federal government has been flat since 2009, while state and local government employment has declined.
The state rankings for federal and state government employees overlap quite a bit with the ranking of states by overall government employment. By contrast, different states emerge in the ranking of local government employees.
The states with the highest levels of federal government employees are led by the District of Columbia, with 18.8% of its resident workers employed by the federal government. Maryland and Hawaii rank second and third, respectively.
The five states with the highest percentage of state government workers include Alaska, Hawaii, West Virginia, and New Mexico, which are also ranked highly for federal workers. Arkansas also makes the cut.
States with the highest percentages of local government workers include Maryland in fifth place, but are led by New York, followed by neighboring Connecticut, and then Wyoming and Tennessee.
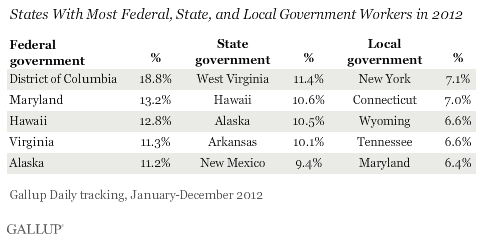
For a complete listing of federal, state, and local employment by state, see page 2.
Gallup's "State of the States" series reveals state-by-state differences on political, economic, and well-being measures Gallup tracks each day. New stories based on full-year 2012 data will be released throughout the month of February.
Survey Methods
Results are based on telephone interviews conducted as part of Gallup Daily tracking from Jan. 1-Dec. 31, 2012, with a random sample of 200,225 employed adults, aged 18 and older, selected using random-digit-dial sampling.
For results based on the total sample of national adults, one can say with 95% confidence that the maximum margin of sampling error is less than ±1 percentage point.
Margins of error for individual states are no greater than ±6 percentage points, and are ±3 percentage points in most states. The margin of error for the District of Columbia is ±6 percentage points.
Interviews are conducted with respondents on landline telephones and cellular phones, with interviews conducted in Spanish for respondents who are primarily Spanish-speaking. Each national sample includes a minimum quota of 400 cell phone respondents and 600 landline respondents per 1,000 national adults, with additional minimum quotas among landline respondents by region. Landline telephone numbers are chosen at random among listed telephone numbers. Cell phones numbers are selected using random digit dial methods. Landline respondents are chosen at random within each household on the basis of which member had the most recent birthday.
State samples are weighted to be representative of the state's adult population by gender, age, race, Hispanic ethnicity, and education based on the March 2012 Current Population Survey. All reported margins of sampling error include the computed design effects for weighting.
In addition to sampling error, question wording and practical difficulties in conducting surveys can introduce error or bias into the findings of public opinion polls.
For more details on Gallup's polling methodology, visit www.gallup.com.
